

Answered step by step
Verified Expert Solution
Question
1 Approved Answer
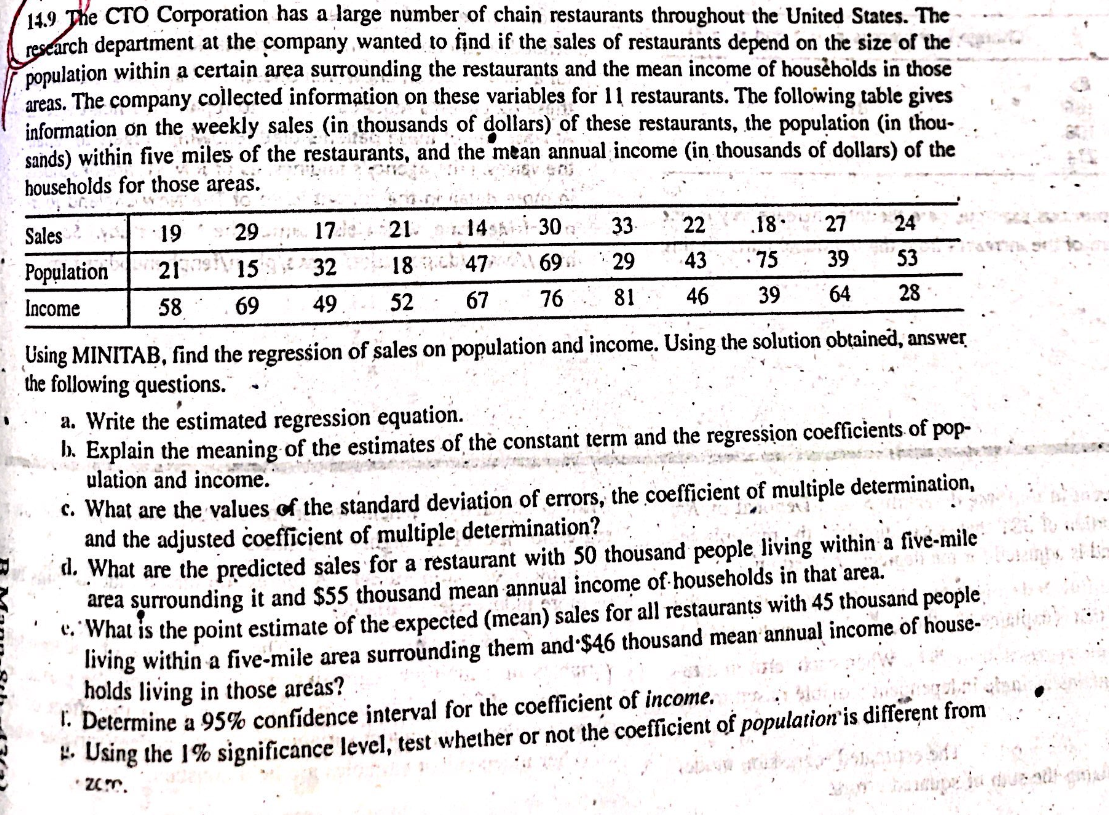
14.9 The CTO Corporation has a large number of chain restaurants throughout the United States. The research department at the company wanted to find if

Step by Step Solution
There are 3 Steps involved in it
Step: 1

Get Instant Access to Expert-Tailored Solutions
See step-by-step solutions with expert insights and AI powered tools for academic success
Step: 2

Step: 3
Ace Your Homework with AI
Get the answers you need in no time with our AI-driven, step-by-step assistance
Get Started
Algebra And Trigonometry Enhanced With Graphing Utilities (Subscription)
Authors: Michael Sullivan, Michael Sullivan III
7th Edition
0134273842, 9780134273846