Answered step by step
Verified Expert Solution
Question
1 Approved Answer
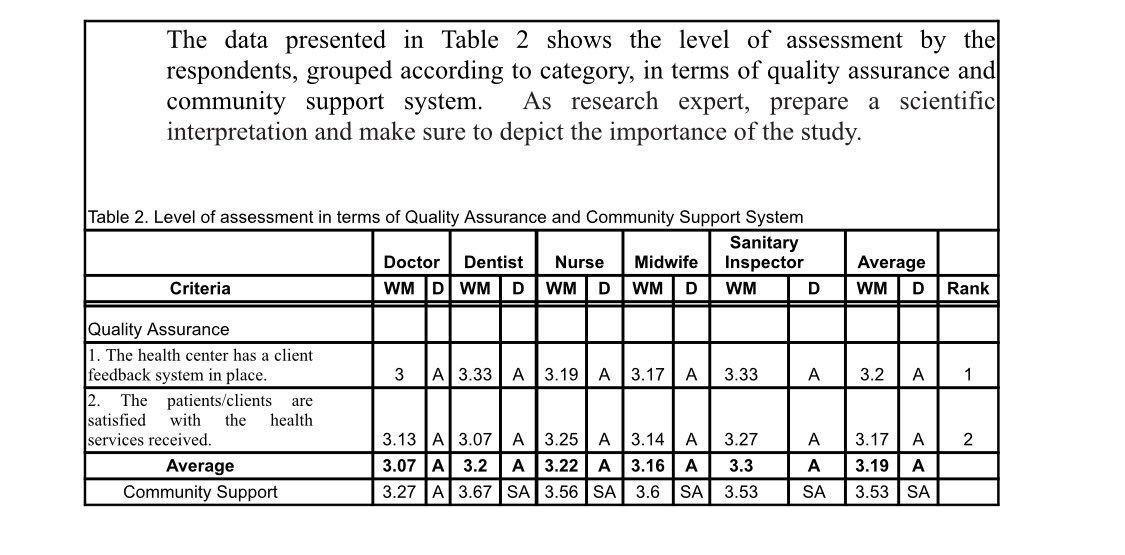
The data presented in Table 2 shows the level of assessment by the respondents, grouped according to category, in terms of quality assurance and

The data presented in Table 2 shows the level of assessment by the respondents, grouped according to category, in terms of quality assurance and community support system. As research expert, prepare a scientific interpretation and make sure to depict the importance of the study. Table 2. Level of assessment in terms of Quality Assurance and Community Support System Sanitary Inspector Average WM Criteria Quality Assurance 1. The health center has a client feedback system in place. 2. The patients/clients are satisfied with the health services received. Average Community Support Doctor Dentist Nurse Midwife WM D WM D WM D WM D 3 A 3.33 A 3.19 A 3.17 A 3.13 A 3.07 A 3.25 A 3.14 3.27 3.07 A 3.2 A 3.22 A 3.16 A 3.3 3.27 A 3.67 SA 3.56 SA 3.6 SA 3.53 AAS 3.33 D WM D Rank A AAS 3.2 A 1 3.17 A >> 3.19 A SA 3.53 SA 2
Step by Step Solution
★★★★★
3.49 Rating (162 Votes )
There are 3 Steps involved in it
Step: 1
Based on the data presented in Table 2 the level of assessment in terms of Quality Assurance and Community Support System was evaluated for different ...
Get Instant Access to Expert-Tailored Solutions
See step-by-step solutions with expert insights and AI powered tools for academic success
Step: 2

Step: 3

Ace Your Homework with AI
Get the answers you need in no time with our AI-driven, step-by-step assistance
Get Started


