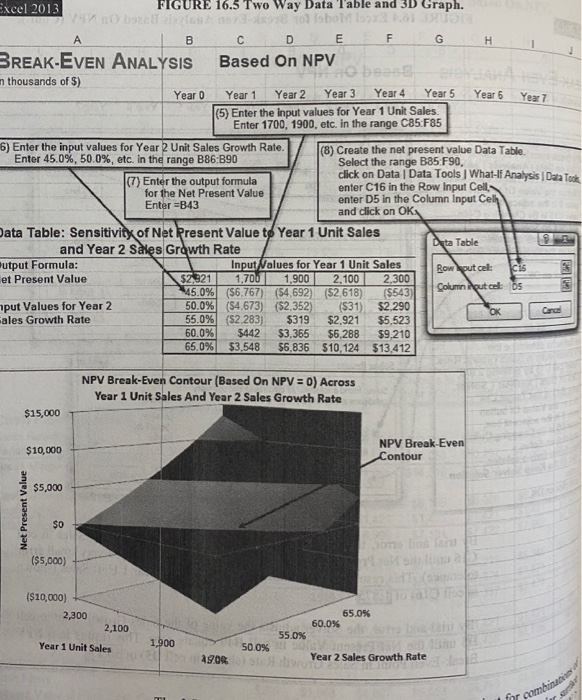
16-5) Based on the Data Table in Figure 16.5, is the project's Net Present Value of $2,921 more sensitive to the Year 1 Unit Sales or to the Year 2 Sales Growth Rate? Justify your answer with numbers and explain why the NPV is more sensitive to the identified factor. Excel 2013 FIGURE 16.3 Two Way Data Table and 3D Graph. H C D E F G BREAK-EVEN ANALYSIS Based On NPV obez n thousands of 5) Year 0 Year 1 Year 2 Year 3 Year 4 Year 5 15) Enter the input values for Year 1 Unit Sales Enter 1700, 1900, etc. in the range C85:F85 Year 6 Year 6) Enter the input values for Year 2 Unit Sales Growth Rate. (8) Create the net present value Data Table Enter 45.0%, 50.0%, etc. in the range B86:890 Select the range B85:F90, click on Data Data Tools What-lf Analysis Data Took (7) Enter the output formula enter C16 in the Row Input Cell for the Net Present Value enter D5 in the Column Input Cell Enter =B43 and click on OK Data Table: Sensitivity of Net Present Value to Year 1 Unit Sales and Year 2 Sales Growth Rate utput Formula: Input Nalues for Year 1 Unit Sales Row put cel: CS et Present Value \$2,921 1,700 1,900 2,100 2,300 45.0% ($6.767) (54,692) (52,618) ($543) 11 Solun put cel: Os put Values for Year 2 50.0% ($4.673) ($2,352) ($31) $2,290 ales Growth Rate 55.0% (52.283) $319 $2.921 $5,523 60.0% $442 $3,365 $6,288 $9,210 65.0% $3,548 56,836 $10,124 $13.412 Data Table 1 NPV Break-Even Contour (Based On NPV = 0) Across Year 1 Unit Sales And Year 2 Sales Growth Rate $15,000 $10,000 NPV Break-Even Contour $5,000 Net Present Value ($5,000) ($10,000) 2,300 2,100 65.0% 60.0% 1500 55.0% Year 1 Unit Sales es 50.0% 490% Year 2 Sales Growth Rate nr cambi 16-5) Based on the Data Table in Figure 16.5, is the project's Net Present Value of $2,921 more sensitive to the Year 1 Unit Sales or to the Year 2 Sales Growth Rate? Justify your answer with numbers and explain why the NPV is more sensitive to the identified factor. Excel 2013 FIGURE 16.3 Two Way Data Table and 3D Graph. H C D E F G BREAK-EVEN ANALYSIS Based On NPV obez n thousands of 5) Year 0 Year 1 Year 2 Year 3 Year 4 Year 5 15) Enter the input values for Year 1 Unit Sales Enter 1700, 1900, etc. in the range C85:F85 Year 6 Year 6) Enter the input values for Year 2 Unit Sales Growth Rate. (8) Create the net present value Data Table Enter 45.0%, 50.0%, etc. in the range B86:890 Select the range B85:F90, click on Data Data Tools What-lf Analysis Data Took (7) Enter the output formula enter C16 in the Row Input Cell for the Net Present Value enter D5 in the Column Input Cell Enter =B43 and click on OK Data Table: Sensitivity of Net Present Value to Year 1 Unit Sales and Year 2 Sales Growth Rate utput Formula: Input Nalues for Year 1 Unit Sales Row put cel: CS et Present Value \$2,921 1,700 1,900 2,100 2,300 45.0% ($6.767) (54,692) (52,618) ($543) 11 Solun put cel: Os put Values for Year 2 50.0% ($4.673) ($2,352) ($31) $2,290 ales Growth Rate 55.0% (52.283) $319 $2.921 $5,523 60.0% $442 $3,365 $6,288 $9,210 65.0% $3,548 56,836 $10,124 $13.412 Data Table 1 NPV Break-Even Contour (Based On NPV = 0) Across Year 1 Unit Sales And Year 2 Sales Growth Rate $15,000 $10,000 NPV Break-Even Contour $5,000 Net Present Value ($5,000) ($10,000) 2,300 2,100 65.0% 60.0% 1500 55.0% Year 1 Unit Sales es 50.0% 490% Year 2 Sales Growth Rate nr cambi


