*18.7 Mark Hancock Inc. manufactures a specialized surgical instrument called the HAN-20. The firm has grown rapidly in recent years because of the products low price and high quality. However, sales have declined this year primarily due to increased competition and a decrease in the surgical procedures for which the HAN-20 is used. The firm is concerned about the decline in sales and has hired a consultant to analyze the firms profitability. The consultant was provided the following information:
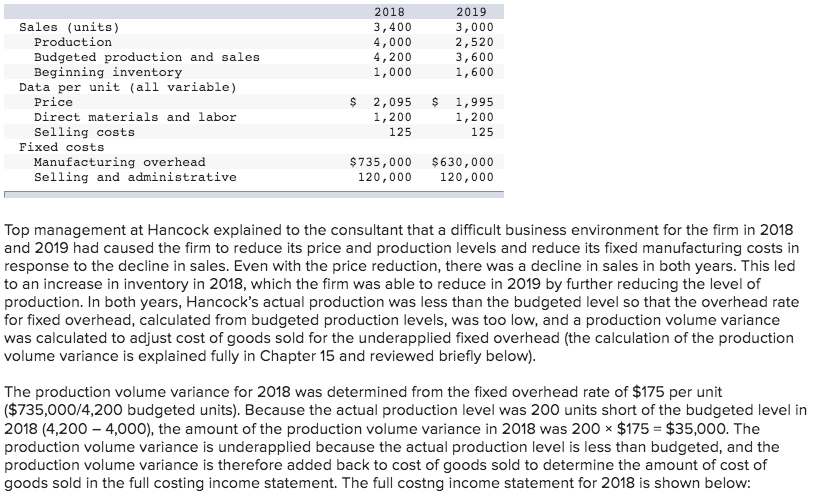
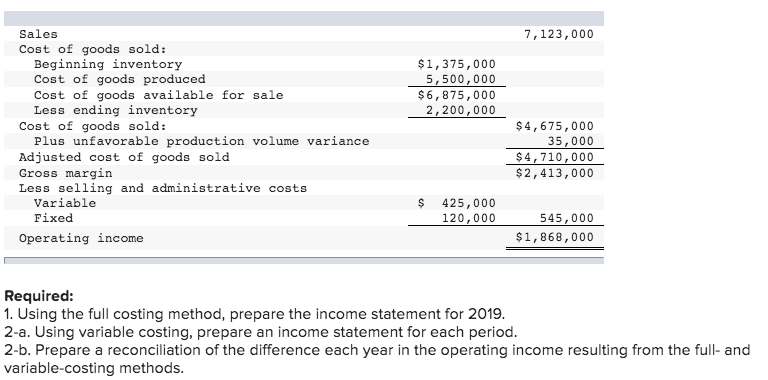
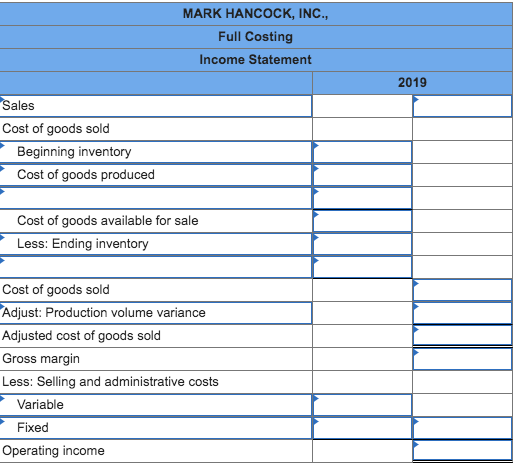
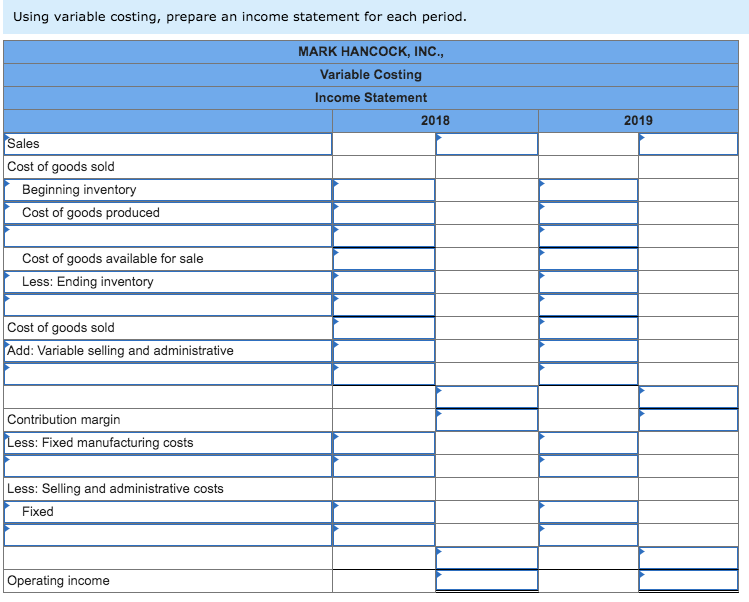
2018 2019 Sales (units) 3,400 4,000 4,200 3,000 2,520 Production Budgeted production and sales Beginning inventory Data per unit (all variable) 3,600 1,600 1,000 $ 2,095 1,200 Price 1,995 1,200 Direct materials and labor Selling costs 125 125 Fixed costs Manufacturing overhead Selling and administrative $735,000 $630,000 120,000 120,000 Top management at Hancock explained to the consultant that a difficult business environment for the firm in 2018 and 2019 had caused the firm to reduce its price and production levels and reduce its fixed manufacturing costs in response to the decline in sales. Even with the price reduction, there was a decline in sales in both years. This led to an increase in inventory in 2018, which the firm was able to reduce in 2019 by further reducing the level of production. In both years, Hancock's actual production was less than the budgeted level so that the overhead rate for fixed overhead, calculated from budgeted production levels, was too low, and a production volume variance was calculated to adjust cost of goods sold for the underapplied fixed overhead (the calculation of the production volume variance is explained fully in Chapter 15 and reviewed briefly below). The production volume variance for 2018 was determined from the fixed overhead rate of $175 per unit ($735,000/4,200 budgeted units). Because the actual production level was 200 units short of the budgeted level in 2018 (4,200 4,000), the amount of the production volume variance in 2018 was 200 $175 = $35,000. The production volume variance is underapplied because the actual production level is less than budgeted, and the production volume variance is therefore added back to cost of goods sold to determine the amount of cost of goods sold in the full costing income statement. The full costng income statement for 2018 is shown below: Sales Cost of goods sold: Beginning inventory Cost of goods produced Cost of goods available for sale Less ending inventory Cost of goods sold: Plus unfavorable production volume variance 7,123,000 $1,375,000 5,500,000 $6,875,000 2,200,000 $4,675,000 35,000 $4,710,000 $2,413,000 Adjusted cost of goods sold Gross margin Less selling and administrative costs Variable 425,000 120,000 Fixed 545,000 $1,868,000 Operating income Required: 1. Using the full costing method, prepare the income statement for 2019. 2-a. Using variable costing, prepare an income statement for each period. 2-b. Prepare a reconciliation of the difference each year in the operating income resulting from the full- and variable-costing methods. MARK HANCOCK, INC., Full Costing Income Statement 2019 Sales Cost of goods sold Beginning inventory Cost of goods produced Cost of goods available for sale Less: Ending inventory Cost of goods sold Adjust: Production volume variance Adjusted cost of goods sold Gross margin Less: Selling and administrative costs Variable Fixed Operating income Using variable costing, prepare an income statement for each period. MARK HANCOCK, INC., Variable Costing Income Statement 2018 2019 Sales Cost of goods sold Beginning inventory Cost of goods produced Cost of goods available for sale Less: Ending inventory Cost of goods sold Add: Variable selling and administrative Contribution margin Less: Fixed manufacturing costs Less: Selling and administrative costs Fixed Operating income MARK HANCOCK, INC., Reconciling Difference in Net Income Between Absoprtion and Variable Costing 2018 2019 Change in inventory in units Multiply times fixed overhead rate Difference in net income %24 2018 2019 Sales (units) 3,400 4,000 4,200 3,000 2,520 Production Budgeted production and sales Beginning inventory Data per unit (all variable) 3,600 1,600 1,000 $ 2,095 1,200 Price 1,995 1,200 Direct materials and labor Selling costs 125 125 Fixed costs Manufacturing overhead Selling and administrative $735,000 $630,000 120,000 120,000 Top management at Hancock explained to the consultant that a difficult business environment for the firm in 2018 and 2019 had caused the firm to reduce its price and production levels and reduce its fixed manufacturing costs in response to the decline in sales. Even with the price reduction, there was a decline in sales in both years. This led to an increase in inventory in 2018, which the firm was able to reduce in 2019 by further reducing the level of production. In both years, Hancock's actual production was less than the budgeted level so that the overhead rate for fixed overhead, calculated from budgeted production levels, was too low, and a production volume variance was calculated to adjust cost of goods sold for the underapplied fixed overhead (the calculation of the production volume variance is explained fully in Chapter 15 and reviewed briefly below). The production volume variance for 2018 was determined from the fixed overhead rate of $175 per unit ($735,000/4,200 budgeted units). Because the actual production level was 200 units short of the budgeted level in 2018 (4,200 4,000), the amount of the production volume variance in 2018 was 200 $175 = $35,000. The production volume variance is underapplied because the actual production level is less than budgeted, and the production volume variance is therefore added back to cost of goods sold to determine the amount of cost of goods sold in the full costing income statement. The full costng income statement for 2018 is shown below: Sales Cost of goods sold: Beginning inventory Cost of goods produced Cost of goods available for sale Less ending inventory Cost of goods sold: Plus unfavorable production volume variance 7,123,000 $1,375,000 5,500,000 $6,875,000 2,200,000 $4,675,000 35,000 $4,710,000 $2,413,000 Adjusted cost of goods sold Gross margin Less selling and administrative costs Variable 425,000 120,000 Fixed 545,000 $1,868,000 Operating income Required: 1. Using the full costing method, prepare the income statement for 2019. 2-a. Using variable costing, prepare an income statement for each period. 2-b. Prepare a reconciliation of the difference each year in the operating income resulting from the full- and variable-costing methods. MARK HANCOCK, INC., Full Costing Income Statement 2019 Sales Cost of goods sold Beginning inventory Cost of goods produced Cost of goods available for sale Less: Ending inventory Cost of goods sold Adjust: Production volume variance Adjusted cost of goods sold Gross margin Less: Selling and administrative costs Variable Fixed Operating income Using variable costing, prepare an income statement for each period. MARK HANCOCK, INC., Variable Costing Income Statement 2018 2019 Sales Cost of goods sold Beginning inventory Cost of goods produced Cost of goods available for sale Less: Ending inventory Cost of goods sold Add: Variable selling and administrative Contribution margin Less: Fixed manufacturing costs Less: Selling and administrative costs Fixed Operating income MARK HANCOCK, INC., Reconciling Difference in Net Income Between Absoprtion and Variable Costing 2018 2019 Change in inventory in units Multiply times fixed overhead rate Difference in net income %24