Question
19. The following table contains nominal and real GDP data, in billions of dollars, from the U.S. Bureau of Economic Analysis for 2011 and

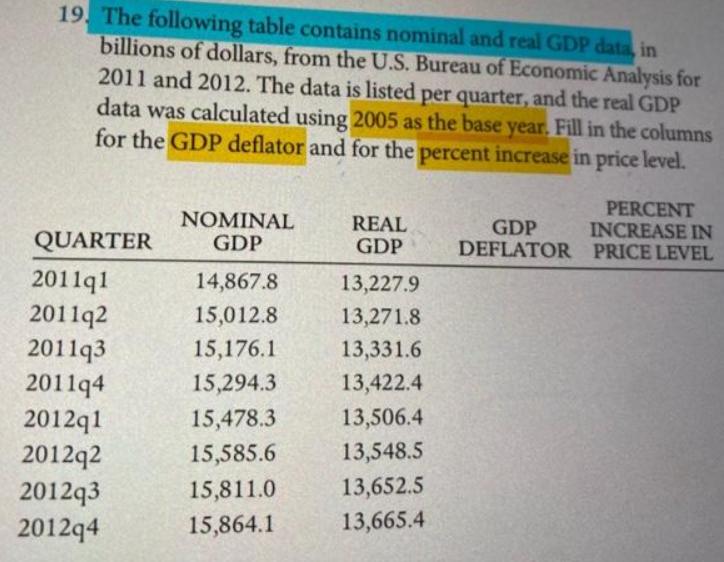
19. The following table contains nominal and real GDP data, in billions of dollars, from the U.S. Bureau of Economic Analysis for 2011 and 2012. The data is listed per quarter, and the real GDP data was calculated using 2005 as the base year. Fill in the columns for the GDP deflator and for the percent increase in price level. QUARTER 2011q1 2011q2 2011q3 201194 2012q1 2012q2 2012q3 2012q4 NOMINAL GDP 14,867.8 15,012.8 15,176.1 15,294.3 15,478.3 15,585.6 15,811.0 15,864.1 REAL GDP 13,227.9 13,271.8 13,331.6 13,422.4 13,506.4 13,548.5 13,652.5 13,665.4 GDP DEFLATOR PERCENT INCREASE IN PRICE LEVEL
Step by Step Solution
3.56 Rating (160 Votes )
There are 3 Steps involved in it
Step: 1
Step 1 GDP Deflator GDP deflator is the measure of the change in the prices of all the goods and ser...
Get Instant Access to Expert-Tailored Solutions
See step-by-step solutions with expert insights and AI powered tools for academic success
Step: 2

Step: 3

Ace Your Homework with AI
Get the answers you need in no time with our AI-driven, step-by-step assistance
Get StartedRecommended Textbook for
Principles of Macroeconomics
Authors: Karl E. Case, Ray C. Fair, Sharon E. Oster
12th edition
134078802, 978-0134078809
Students also viewed these Accounting questions
Question
Answered: 1 week ago
Question
Answered: 1 week ago
Question
Answered: 1 week ago
Question
Answered: 1 week ago
Question
Answered: 1 week ago
Question
Answered: 1 week ago
Question
Answered: 1 week ago
Question
Answered: 1 week ago
Question
Answered: 1 week ago
Question
Answered: 1 week ago
Question
Answered: 1 week ago
Question
Answered: 1 week ago
Question
Answered: 1 week ago
Question
Answered: 1 week ago
Question
Answered: 1 week ago
Question
Answered: 1 week ago
Question
Answered: 1 week ago
Question
Answered: 1 week ago
Question
Answered: 1 week ago
Question
Answered: 1 week ago
Question
Answered: 1 week ago
Question
Answered: 1 week ago
Question
Answered: 1 week ago
Question
Answered: 1 week ago
View Answer in SolutionInn App


