Answered step by step
Verified Expert Solution
Question
1 Approved Answer
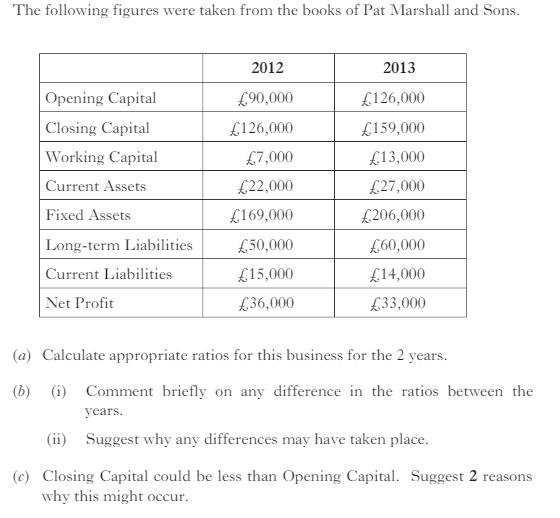
The following figures were taken from the books of Pat Marshall and Sons. Opening Capital Closing Capital Working Capital Current Assets Fixed Assets Long-term

The following figures were taken from the books of Pat Marshall and Sons. Opening Capital Closing Capital Working Capital Current Assets Fixed Assets Long-term Liabilities Current Liabilities Net Profit 2012 90,000 126,000 7,000 22,000 169,000 50,000 15,000 36,000 2013 126,000 159,000 13,000 27,000 206,000 60,000 14,000 33,000 (a) Calculate appropriate ratios for this business for the 2 years. (b) (i) Comment briefly on any difference in the ratios between the years. (ii) Suggest why any differences may have taken place. (c) Closing Capital could be less than Opening Capital. Suggest 2 reasons why this might occur.
Step by Step Solution
★★★★★
3.52 Rating (149 Votes )
There are 3 Steps involved in it
Step: 1
a Profit Margin Net Profit Revenue 2012 13000 490000 27 2013 27000 201000 134 Asset Turnover Revenue ...
Get Instant Access to Expert-Tailored Solutions
See step-by-step solutions with expert insights and AI powered tools for academic success
Step: 2

Step: 3

Document Format ( 2 attachments)
635d901c7f256_176779.pdf
180 KBs PDF File
635d901c7f256_176779.docx
120 KBs Word File
Ace Your Homework with AI
Get the answers you need in no time with our AI-driven, step-by-step assistance
Get Started


