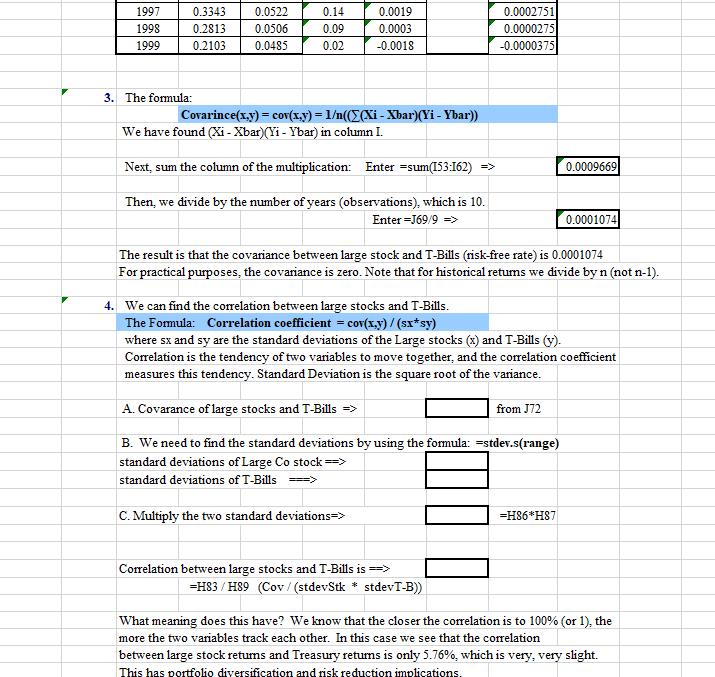
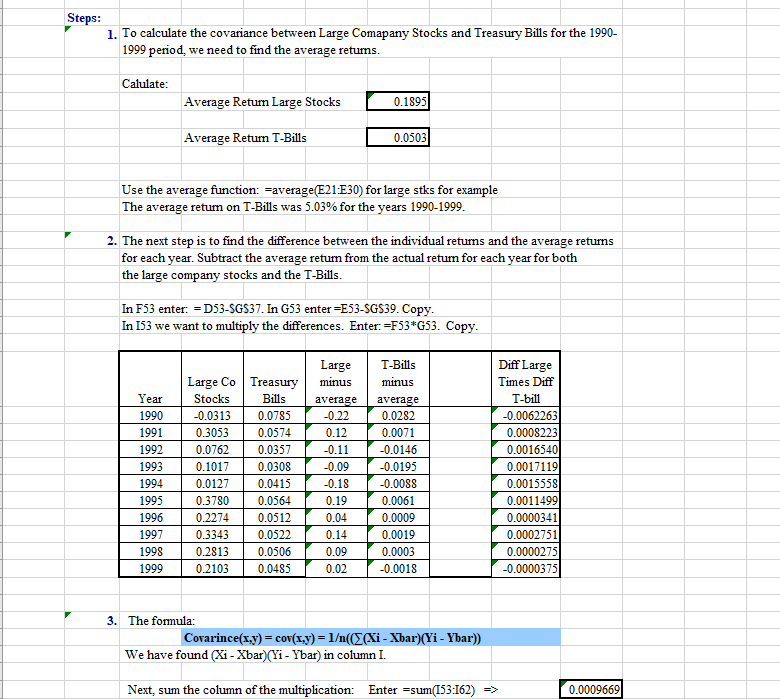
1997 1998 1999 0.3343 0.2813 0.2103 0.0522 0.0506 0.0485 0.14 0.09 0.02 0.0019 0.0003 -0.0018 0.0002751 0.0000275 -0.0000375 3. The formula: Covarince(x,y) = cov(x,y) = 1(((Xi - Xbar)(Yi - Ybar)) We have found (Xi - Xbar)(Yi - Ybar) in column I. Next, sum the column of the multiplication: Enter =sum(153:162) => 0.0009669 Then, we divide by the number of years (observations), which is 10. Enter =J69/9 => 0.0001074 The result is that the covariance between large stock and T-Bills (risk-free rate) is 0.0001074 For practical purposes, the covariance is zero. Note that for historical retums we divide by n (not n-1). 4. We can find the correlation between large stocks and T-Bills. The Formula: Correlation coefficient = cov(x,y)/(sx*sy) where sx and sy are the standard deviations of the Large stocks (x) and T-Bills (y). Correlation is the tendency of two variables to move together, and the correlation coefficient measures this tendency. Standard Deviation is the square root of the variance. A. Covarance of large stocks and T-Bills => from J72 B. We need to find the standard deviations by using the formula: Estdev.s(range) standard deviations of Large Co stock => standard deviations of T-Bills = C. Multiply the two standard deviations =H86*H87 Correlation between large stocks and T-Bills is => =H83/H89 (Cov/(stdevStk * stdevT-B) What meaning does this have? We know that the closer the correlation is to 100% (or 1), the more the two variables track each other. In this case we see that the correlation between large stock retums and Treasury retums is only 5.76%, which is very, very slight. This has portfolio diversification and risk reduction implications. Steps: 1. To calculate the covariance between Large Comapany Stocks and Treasury Bills for the 1990- 1999 period, we need to find the average retums. Catulate: Average Return Large Stocks 0.1895 Average Return T-Bills 0.0503 Use the average function: =average(E21:E30) for large stks for example The average retum on T-Bills was 5.03% for the years 1990-1999. 2. The next step is to find the difference between the individual returns and the average retums for each year. Subtract the average return from the actual return for each year for both the large company stocks and the T-Bills. In F53 enter: - D53-$G$37. In G53 enter=E53-SGS39. Copy. In 153 we want to multiply the differences. Enter.=F53*G53. Copy. Year 1990 1991 1992 1993 1994 1995 1996 1997 1998 1999 Large Co Treasury Stocks Bills -0.0313 0.0785 0.3053 0.0574 0.0762 0.0357 0.1017 0.0308 0.0127 0.0415 0.3780 0.0564 0.2274 0.0512 0.3343 0.0522 0.2813 0.0506 0.2103 0.0485 Large minus average -0.22 0.12 -0.11 -0.09 -0.18 0.19 0.04 0.14 0.09 0.02 T-Bills minus average 0.0282 0.0071 -0.0146 -0.0195 -0.0088 0.0061 0.0009 0.0019 0.0003 -0.0018 Diff Large Times Diff T-bill -0.0062263 0.0008223 0.0016540 0.0017119 0.0015558 0.0011499 0.0000341 0.0002751 0.0000275 -0.0000375 3. The formula: Covarince(x,y) = cov(x,y) = 1(((Xi - Xbar)(Yi - Ybar)) We have found (Xi - Xbar)(Yi - Ybar) in column I. Next, sum the column of the multiplication: Enter =sum(153:162) => 0.0009669