Question
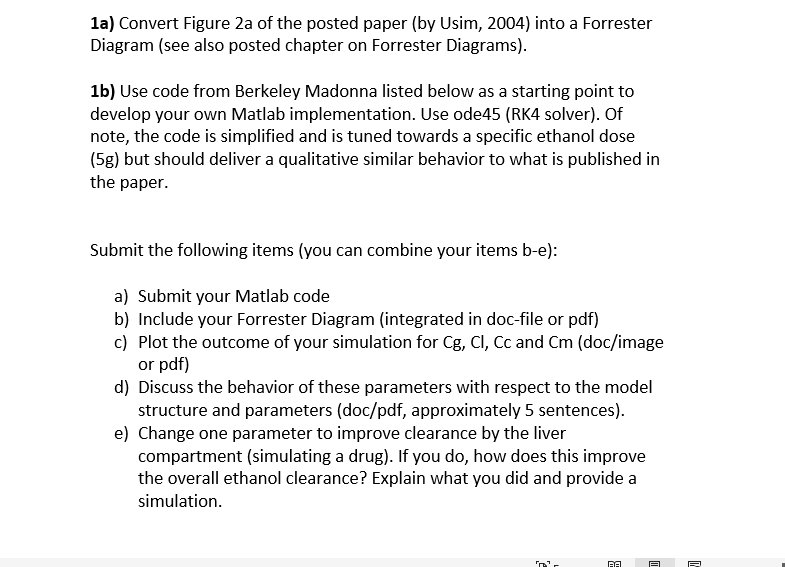
1a) Convert Figure 2a of the posted paper (by Usim, 2004) into a Forrester Diagram (see also posted chapter on Forrester Diagrams). Submit the following
1a) Convert Figure 2a of the posted paper (by Usim, 2004) into a Forrester Diagram (see also posted chapter on Forrester Diagrams). Submit the following items (you can combine your items b-e): Submit your Matlab code Include your Forrester Diagram (integrated in doc-file or pdf) Plot the outcome of your simulation for Cg, Cl, Cc and Cm (doc/image or pdf) Discuss the behavior of these parameters with respect to the model structure and parameters (doc/pdf, approximately 5 sentences). Change one parameter to improve clearance by the liver compartment (simulating a drug). If you do, how does this improve the overall ethanol clearance? Explain what you did and provide a simulation.


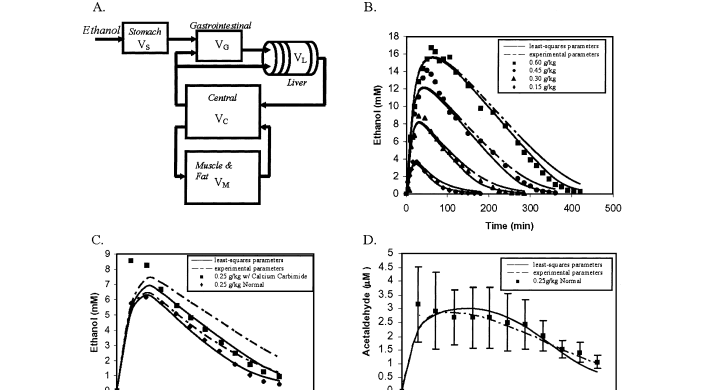
please help!! thank you!! just need help with 1a)The forrester diagram is attached below and should use figure A.
1a) Convert Figure 2a of the posted paper (by Usim, 2004) into a Forrester Diagram (see also posted chapter on Forrester Diagrams). 1b) Use code from Berkeley Madonna listed below as a starting point to develop your own Matlab implementation. Use ode45 (RK4 solver). Of note, the code is simplified and is tuned towards a specific ethanol dose (5g) but should deliver a qualitative similar behavior to what is published in the paper. Submit the following items (you can combine your items b-e): a) Submit your Matlab code b) Include your Forrester Diagram (integrated in doc-file or pdf) c) Plot the outcome of your simulation for Cg,Cl,Cc and Cm (doc/image or pdf) d) Discuss the behavior of these parameters with respect to the model structure and parameters (doc/pdf, approximately 5 sentences). e) Change one parameter to improve clearance by the liver compartment (simulating a drug). If you do, how does this improve the overall ethanol clearance? Explain what you did and provide a simulation. 1a) Convert Figure 2a of the posted paper (by Usim, 2004) into a Forrester Diagram (see also posted chapter on Forrester Diagrams). 1b) Use code from Berkeley Madonna listed below as a starting point to develop your own Matlab implementation. Use ode45 (RK4 solver). Of note, the code is simplified and is tuned towards a specific ethanol dose (5g) but should deliver a qualitative similar behavior to what is published in the paper. Submit the following items (you can combine your items b-e): a) Submit your Matlab code b) Include your Forrester Diagram (integrated in doc-file or pdf) c) Plot the outcome of your simulation for Cg,Cl,Cc and Cm (doc/image or pdf) d) Discuss the behavior of these parameters with respect to the model structure and parameters (doc/pdf, approximately 5 sentences). e) Change one parameter to improve clearance by the liver compartment (simulating a drug). If you do, how does this improve the overall ethanol clearance? Explain what you did and provide a simulationStep by Step Solution
There are 3 Steps involved in it
Step: 1

Get Instant Access to Expert-Tailored Solutions
See step-by-step solutions with expert insights and AI powered tools for academic success
Step: 2

Step: 3

Ace Your Homework with AI
Get the answers you need in no time with our AI-driven, step-by-step assistance
Get Started


