1a) Fully state the main advantage of forecasting the inflation rate separately for calculating
Net Present Value.
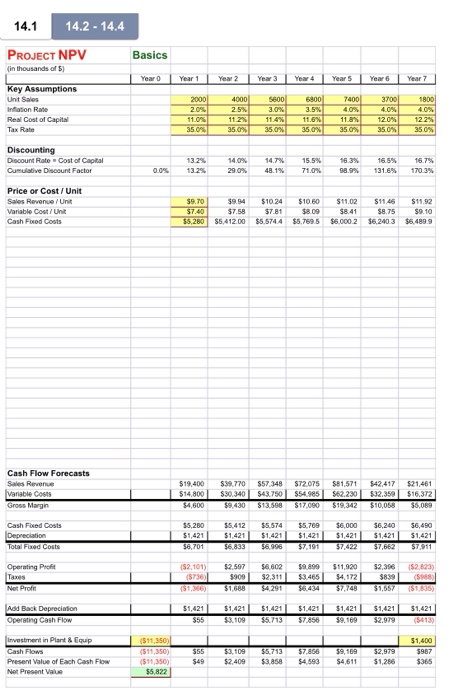
1b) Fully explain why the Discount Rate is increasing over the years in Figure 14.1.
1c) State all the steps for calculating the Operating Cash Flow in Figure 14.2, starting with Sales Revenue.
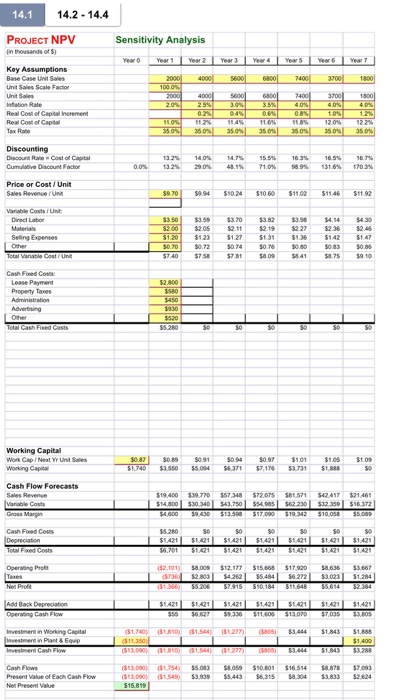
1d) Fully explain why the NPV falls from $5,822 in Figure 14.2 to $3,180 in Figure 14.4 even though the investment in working capital in years 1 to 4 is fully recovered in years 5 to 7.
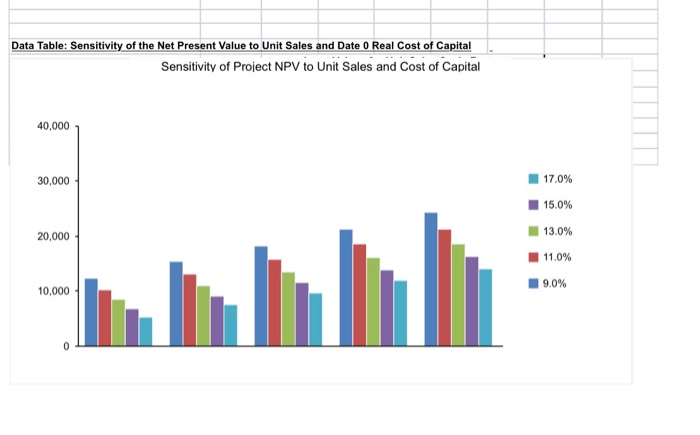
1e) Based on the Data Table in Figure 14.6, if the Unit Sales Scale Factor is 100%, what is the maximum Date 1 Real Cost of Capital at which the project will be acceptable? Why?
Page No. Question
1f) Based on the Data Table in Figure 14.6, if the Date 1 Real Cost of Capital is 11.0%, what is the minimum Unit Sales Scale Factor at which the project will be acceptable? Why?
14.1 14.2 - 14.4 PROJECT NPV Basics in thousands of Year Year 1 Year 2 Year 3 Yeart Years Yar Yar 7 Key Assumptions Unt Sales Wation R Real Cost of Capit Tu Discounting Discount Rate Cost of Capital Gume Discount Factor 16.5 13.2% 13.2% 16.7 170,3% 29.0% 78.0% 98% Price or Cost/Unit Sales Revenue Unit Variable Cost/Unt Cash Food Costs $10.24 $1060 $7.81 $800 $55744 1579 $7.58 $5.412.00 1102 841 0 002 $11.45 387 62403 $112 $0.10 409 5.280 Cash Flow Forecasts Ivanale co $19 400 $14800 54.600 $39770 330 340 $9.430 $57 348 $43.750 $13.50 $72.075 $545 $17.690 81.571 562 230 $79.342 42417 $32.35 STOOS 21.461 316 3721 5089 Gross Margin Cash Food Costs Depreciation TO Cols 55.280 $1.421 $6.701 $5.412 $1.421 $6.833 55.574 35.79 000 51.4211 $14201 $141 56 906 $7,191 $7.422 200 142 37.662 490 1411 Opergh $2101) 3736 5000 IT 52 597 56 62 909 52 311 $1683 149 59 999 $11.920 334554172 $2.36 5223 839 15335 Add Back Depreciation Operang Cash $1,221 $55 $1.42 109 1.625 5.713 $1,020 7.850 $1,625 3.50 $1,421 32. 51,621 investment in Plant & Equp $11.350) 555 $49 3 3109 $2.409 35733 $3.858 856 54 593 39.169 $4 511 52.979 5126 Pre Value of Each Cash Flow Net Present 599 350 $5.822 14.1 14.2 - 14.4 PROJECT NPV in trousands of Sensitivity Analysis Kay Assumptions Base Cases Unit Sale Sale Factor Unte SESE Real Color Reloa EBER Discounting Cost of un contacter B Price or Cost/Unit $11511611 VU $147 147 3072 $758 304 61 800 1.41 8. 9.10 Administration Advertising Working Capital Wong Ca Cash Flow Forecasts 572 625 5 2 $19.400 $0.00 $39770 $0.00 533 0 $0. 417 41 $123051632 Cote 0 $20 .000 $131 . 0 6 30 A rion se $1 $122 $142 $ $12031421 $ 6 27 STOP 51.101 3 1 336 51 31 Wong Ca Plant & Ep Cash Flow Present $3 $13.00315 $ 5 3.399 4505601 516514 $5.443 56,315 $8.304 0 3833 at Each Cash Flow 264 Data Table: Sensitivity of the Net Present Value to Unit Sales and Date 0 Real Cost of Capital Sensitivity of Project NPV to Unit Sales and Cost of Capital 40,000 30,000 17.0% 15.0% 13.0% 20,000 11.0% 9.0% 10,000 14.1 14.2 - 14.4 PROJECT NPV Basics in thousands of Year Year 1 Year 2 Year 3 Yeart Years Yar Yar 7 Key Assumptions Unt Sales Wation R Real Cost of Capit Tu Discounting Discount Rate Cost of Capital Gume Discount Factor 16.5 13.2% 13.2% 16.7 170,3% 29.0% 78.0% 98% Price or Cost/Unit Sales Revenue Unit Variable Cost/Unt Cash Food Costs $10.24 $1060 $7.81 $800 $55744 1579 $7.58 $5.412.00 1102 841 0 002 $11.45 387 62403 $112 $0.10 409 5.280 Cash Flow Forecasts Ivanale co $19 400 $14800 54.600 $39770 330 340 $9.430 $57 348 $43.750 $13.50 $72.075 $545 $17.690 81.571 562 230 $79.342 42417 $32.35 STOOS 21.461 316 3721 5089 Gross Margin Cash Food Costs Depreciation TO Cols 55.280 $1.421 $6.701 $5.412 $1.421 $6.833 55.574 35.79 000 51.4211 $14201 $141 56 906 $7,191 $7.422 200 142 37.662 490 1411 Opergh $2101) 3736 5000 IT 52 597 56 62 909 52 311 $1683 149 59 999 $11.920 334554172 $2.36 5223 839 15335 Add Back Depreciation Operang Cash $1,221 $55 $1.42 109 1.625 5.713 $1,020 7.850 $1,625 3.50 $1,421 32. 51,621 investment in Plant & Equp $11.350) 555 $49 3 3109 $2.409 35733 $3.858 856 54 593 39.169 $4 511 52.979 5126 Pre Value of Each Cash Flow Net Present 599 350 $5.822 14.1 14.2 - 14.4 PROJECT NPV in trousands of Sensitivity Analysis Kay Assumptions Base Cases Unit Sale Sale Factor Unte SESE Real Color Reloa EBER Discounting Cost of un contacter B Price or Cost/Unit $11511611 VU $147 147 3072 $758 304 61 800 1.41 8. 9.10 Administration Advertising Working Capital Wong Ca Cash Flow Forecasts 572 625 5 2 $19.400 $0.00 $39770 $0.00 533 0 $0. 417 41 $123051632 Cote 0 $20 .000 $131 . 0 6 30 A rion se $1 $122 $142 $ $12031421 $ 6 27 STOP 51.101 3 1 336 51 31 Wong Ca Plant & Ep Cash Flow Present $3 $13.00315 $ 5 3.399 4505601 516514 $5.443 56,315 $8.304 0 3833 at Each Cash Flow 264 Data Table: Sensitivity of the Net Present Value to Unit Sales and Date 0 Real Cost of Capital Sensitivity of Project NPV to Unit Sales and Cost of Capital 40,000 30,000 17.0% 15.0% 13.0% 20,000 11.0% 9.0% 10,000


