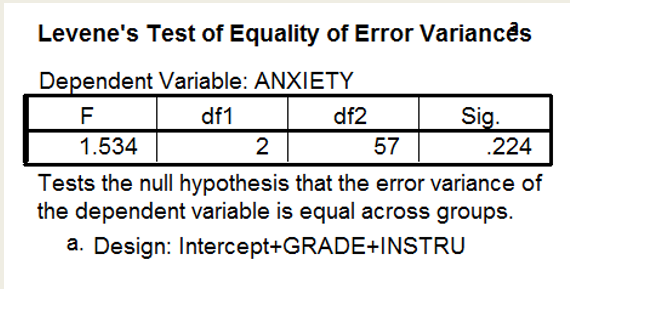
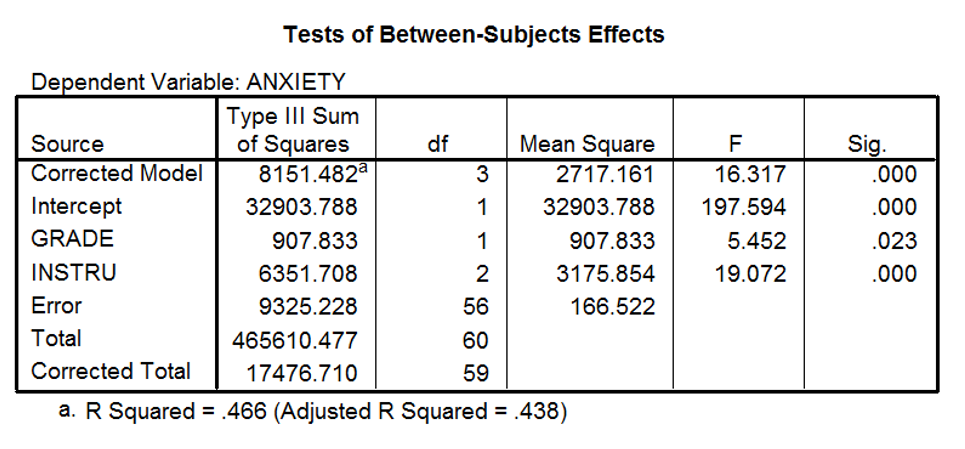
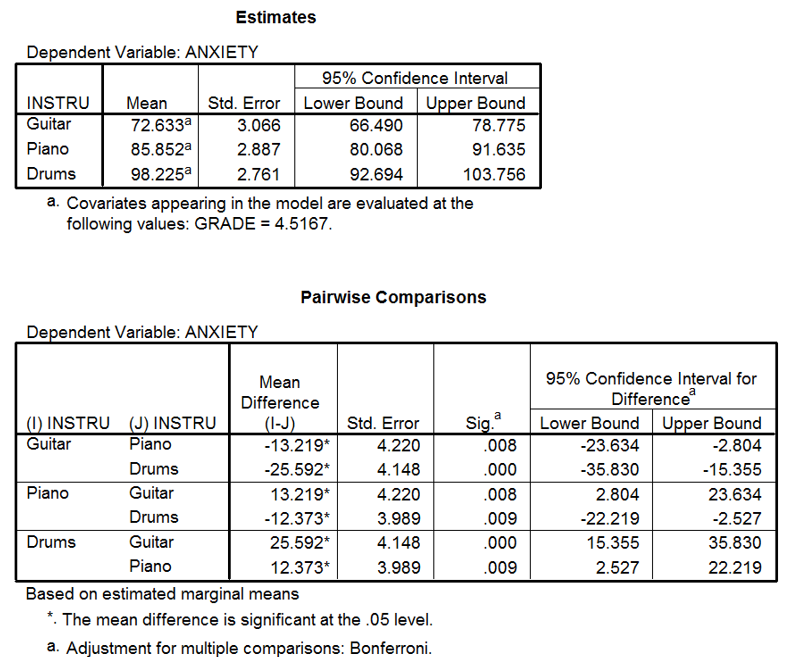
1.A music teacher had noticed that some students went to pieces during exams. He wanted to test whether this performance anxiety was different for people playing different instruments. He took groups of guitarists, drummers and pianists (variable = 'Instru') and measured their anxiety (variable= 'Anxiety') during the exam. He also noted the type of exam they were performing (in the UK, musical instrument exams are known as 'grades' and range from 1 to 8). He wanted to see whether the type of instrument played affected performance anxiety when accounting for the grade of the exam. The first part of the SPSS output is below. What does this part of the output tell us?
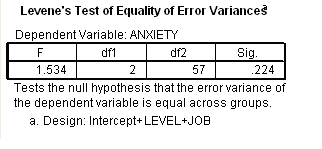
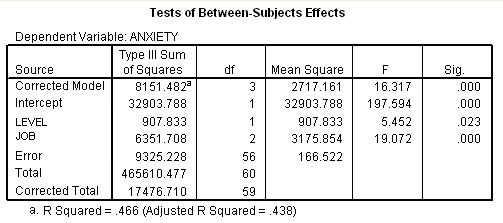
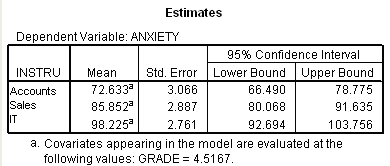
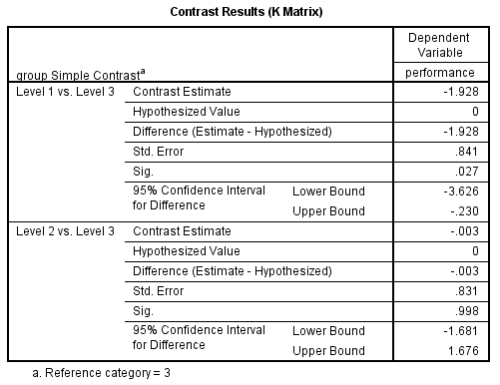
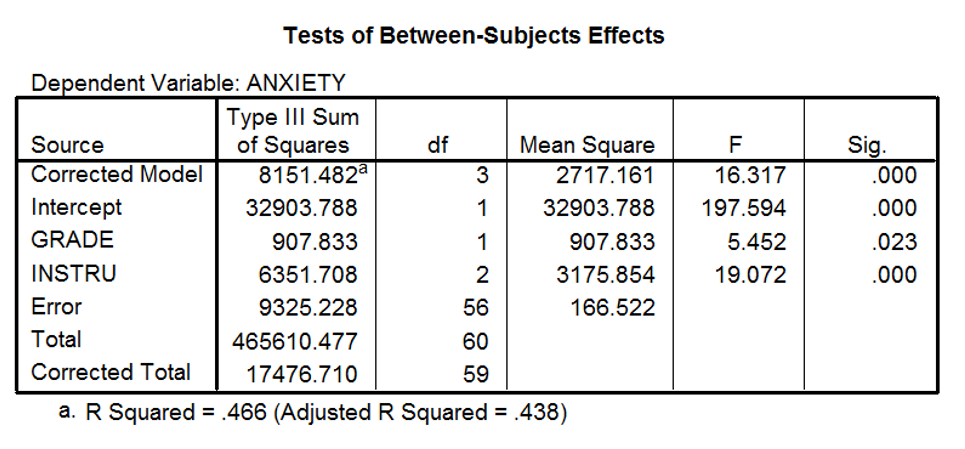
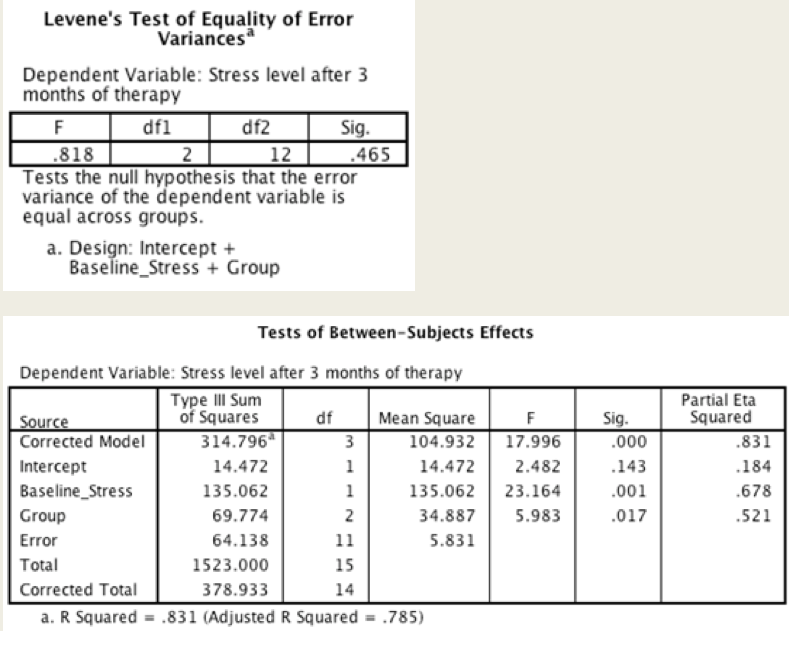
Levene's Test of Equality of Error Variances Dependent Variable: ANXIETY F df1 df2 Sig. 1.534 2 57 224 Tests the null hypothesis that the error variance of the dependent variable is equal across groups. a. Design: Intercept+GRADE+INSTRULevene's Test of Equality of Error Variances Dependent Variable: ANXIETY df1 df2 Sig. 1.534 57 .224 Tests the null hypothesis that the error variance of the dependent variable is equal across groups. a. Design: Intercept+ LEVEL+JOBTests of Between-Subjects Effects Dependent Variable: ANXIETY Type Ill Sum Source of Squares df Mean Square F Sig. Corrected Model 8151.4823 2717.161 16.317 000 Intercept 32903.788 32903.788 197.594 000 LEVEL 907.833 1 907.833 5.452 .023 JOB 6351.708 3175.854 19.072 000 Error 9325.228 56 166.522 Total 465610.477 60 Corrected Total 17476.710 59 a. R Squared = .466 (Adjusted R Squared = .438)Estimates Dependent Variable: ANXIETY 95% Confidence Interval INSTRU Mean Std. Error Lower Bound Upper Bound Accounts 72.6333 3.066 66.490 78.775 Sales 85.852 2.887 80.068 91.635 IT 98.2253 2.761 92.694 103.756 a. Covariates appearing in the model are evaluated at the following values: GRADE = 4.5167.\fTests of Between-Subjects Effects Dependent Variable: ANXIETY Type Ill Sum Source of Squares df Mean Square F Sig Corrected Model 8151.482a 3 2717.161 16.317 000 Intercept 32903.788 1 32903.788 197.594 000 GRADE 907.833 1 907.833 5.452 023 INSTRU 6351.708 2 3175.854 19.072 000 Error 9325.228 56 166.522 Total 465610.477 60 Corrected Total 17476.710 59 a. R Squared = .466 (Adjusted R Squared = .438)Contrast Results (K Matrix) Dependent Variable group Simple Contrast performance Level 1 vs. Level 3 Contrast Estimate -1.928 Hypothesized Value Difference (Estimate - Hypothesized) -1.928 Std. Error 841 Sig. 027 95% Confidence Interval Lower Bound -3.626 for Difference Upper Bound -.230 Level 2 vs. Level 3 Contrast Estimate -.003 Hypothesized Value 0 Difference (Estimate - Hypothesized) -.003 Std. Error .831 Sig. 998 95% Confidence Interval Lower Bound -1.681 for Difference Upper Bound 1.676 a. Reference category = 3Tests of Between-Subjects Effects Dependent Variable: ANXIETY Type Ill Sum Source of Squares df Mean Square F Sig. Corrected Model 8151.482a 2717.161 16.317 000 Intercept 32903.788 32903.788 197.594 000 GRADE 907.833 1 907.833 5.452 023 INSTRU 6351.708 2 3175.854 19.072 000 Error 9325.228 56 166.522 Total 465610.477 60 Corrected Total 17476.710 59 a. R Squared = .466 (Adjusted R Squared = .438)Estimates Dependent Variable: ANXIETY 95% Confidence Interval INSTRU Mean Std. Error Lower Bound Upper Bound Guitar 72.633a 3.066 66.490 78.775 Piano 85.852a 2.887 80.068 91.635 Drums 98.225a 2.761 92.694 103.756 a. Covariates appearing in the model are evaluated at the following values: GRADE = 4.5167. Pairwise Comparisons Dependent Variable: ANXIETY Mean 95% Confidence Interval for Difference Difference (I) INSTRU (J) INSTRU (I-J) Std. Error Sig a Lower Bound Upper Bound Guitar Piano -13.219* 4.220 008 -23.634 -2.804 Drums -25.592* 4.148 000 -35.830 -15.355 Piano Guitar 13.219* 4.220 008 2.804 23.634 Drums -12.373* 3.989 009 -22.219 -2.527 Drums Guitar 25.592* 4.148 000 15.355 35.830 Piano 12.373* 3.989 009 2.527 22.219 Based on estimated marginal means *. The mean difference is significant at the .05 level. a. Adjustment for multiple comparisons: Bonferroni.Levene's Test of Equality of Error Variances Dependent Variable: Stress level after 3 months of therapy F dfl df2 Sig. .818 2 12 465 Tests the null hypothesis that the error variance of the dependent variable is equal across groups. a. Design: Intercept + Baseline_Stress + Group Tests of Between-Subjects Effects Dependent Variable: Stress level after 3 months of therapy Type Ill Sum Partial Eta Source of Squares df Mean Square Sig. Squared Corrected Model 314.796 104.932 17.996 .000 Intercept 14.472 - W .831 14.472 2.482 .143 .184 Baseline_Stress 135.062 135.062 23.164 .001 .678 Group 69.774 2 34.887 5.983 .017 .521 Error 64.138 11 5.831 Total 1523.000 15 Corrected Total 378.933 14 a. R Squared = .831 (Adjusted R Squared = .785)
