Question
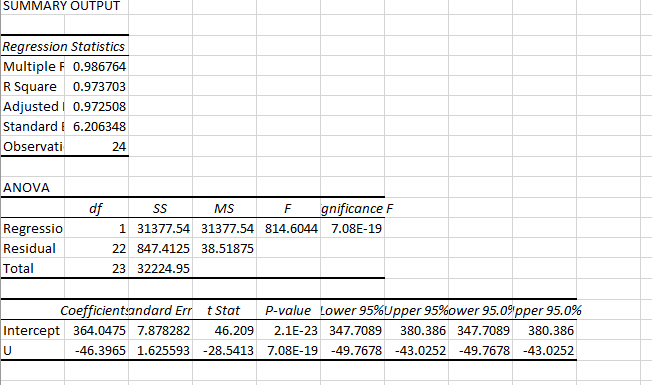
1a): Our regression equation is: HWI = 364.047 - 46.396*U Where b2 is the coefficient of U and the value is -46.396. Yes b2 have


1a): Our regression equation is:
HWI = 364.047 - 46.396*U
Where b2 is the coefficient of U and the value is -46.396. Yes b2 have expected sign where negative sign represent the relationship between HWI and U is negative.
Interpret b2: When level of Unemployment(U) increases by 1 unit then help-wanted index (HWI) decrease by 46.396.
2).
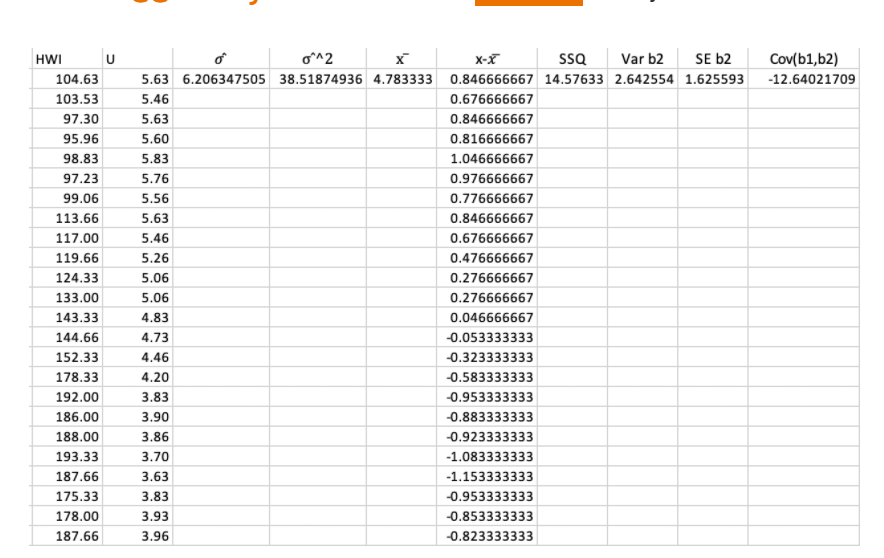
i) For all 24 observations the standard errors are:
b1 = 7.88 and b2 = 1.63
ii) For first 16 observations the standard errors are:
b1 = 17.21 and b2 = 3.26
The standard errors in part ii) are greater than part i)
Because sample size in part ii) is less than part i) in other words if sample size is greater then standard error will be less.
----------------------------------------------------------------------PLEASE ANSWER Q3 AND Q4 -------
3. Use the least squares estimates obtained from question (1) above, and the standard errors obtained in question (2), to construct two 95% interval estimates for b2. (4 marks) Use the first 16 observations for one interval and all 24 observations for the other interval. What factors contribute to the interval from 16 observations being wider? (2 marks)
4. Instead of the linear model that was utilized in the earlier lectures to estimate the relationship between a help-wanted index (HWI) and the level of unemployment (U), consider the log-log model represented by (a) Use all 24 observations to estimate this equation and report the estimated equation along with its standard errors and R2. (2 marks) What interpretation can you place on b2 in this case? (2 marks) (b) Calculate a 95% confidence interval for b2. (2 marks) Do you think our sample has provided precise or reliable information about b2? (2 marks) (c) Re-estimate the model using the first 16 observations and consider again the conjecture about structural unemployment in the last 8 quarters. In your answer consider whether the estimate for b2 has changed much, whether the predictions for HWI for the last 8 quarters are consistently less than the actual values, and whether the observed values for HWI lie within the 95% prediction intervals. (4 marks) (d) Comment on the effect that functional-form choice can have on your conclusions. (2 marks)
PLEASE ANSWER Q3 AND Q4 ANSWERS FROM Q1 AND Q2 ARE PROVIDED.
Cov(b1,b2) -12.64021709 HWI U 104.63 103.53 97.30 95.96 98.83 97.23 99.06 113.66 117.00 119.66 124.33 133.00 143.33 144.66 152.33 178.33 192.00 186.00 188.00 193.33 187.66 175.33 178.00 187.66 o O^2 x X-X ssa Var b2 SE b2 5.63 6.206347505 38.51874936 4.783333 0.846666667 14.57633 2.642554 1.625593 5.46 0.676666667 5.63 0.846666667 5.60 0.816666667 5.83 1.046666667 5.76 0.976666667 5.56 0.776666667 5.63 0.846666667 5.46 0.676666667 5.26 0.476666667 5.06 0.276666667 5.06 0.276666667 4.83 0.046666667 4.73 -0.053333333 4.46 -0.323333333 4.20 -0.583333333 3.83 -0.953333333 3.90 -0.883333333 3.86 -0.923333333 3.70 -1.083333333 3.63 -1.153333333 3.83 -0.953333333 3.93 -0.853333333 3.96 -0.823333333 SUMMARY OUTPUT Regression Statistics Multiple F 0.986764 R Square 0.973703 Adjustedi 0.972508 Standard I 6.206348 Observati 24 ANOVA df Regressio Residual Total SS MS F gnificance F 1 31377.54 31377.54 814.6044 7.08E-19 22 847.4125 38.51875 23 32224.95 Coefficientsandard Err t Stat P-value Lower 95%Upper 95%ower 95.0%pper 95.0% Intercept 364.0475 7.878282 46.209 2.1E-23 347.7089 380.386 347.7089 380.386 U -46.3965 1.625593 -28.5413 7.08E-19 -49.7678 -43.0252 -49.7678 -43.0252 Cov(b1,b2) -12.64021709 HWI U 104.63 103.53 97.30 95.96 98.83 97.23 99.06 113.66 117.00 119.66 124.33 133.00 143.33 144.66 152.33 178.33 192.00 186.00 188.00 193.33 187.66 175.33 178.00 187.66 o O^2 x X-X ssa Var b2 SE b2 5.63 6.206347505 38.51874936 4.783333 0.846666667 14.57633 2.642554 1.625593 5.46 0.676666667 5.63 0.846666667 5.60 0.816666667 5.83 1.046666667 5.76 0.976666667 5.56 0.776666667 5.63 0.846666667 5.46 0.676666667 5.26 0.476666667 5.06 0.276666667 5.06 0.276666667 4.83 0.046666667 4.73 -0.053333333 4.46 -0.323333333 4.20 -0.583333333 3.83 -0.953333333 3.90 -0.883333333 3.86 -0.923333333 3.70 -1.083333333 3.63 -1.153333333 3.83 -0.953333333 3.93 -0.853333333 3.96 -0.823333333 SUMMARY OUTPUT Regression Statistics Multiple F 0.986764 R Square 0.973703 Adjustedi 0.972508 Standard I 6.206348 Observati 24 ANOVA df Regressio Residual Total SS MS F gnificance F 1 31377.54 31377.54 814.6044 7.08E-19 22 847.4125 38.51875 23 32224.95 Coefficientsandard Err t Stat P-value Lower 95%Upper 95%ower 95.0%pper 95.0% Intercept 364.0475 7.878282 46.209 2.1E-23 347.7089 380.386 347.7089 380.386 U -46.3965 1.625593 -28.5413 7.08E-19 -49.7678 -43.0252 -49.7678 -43.0252Step by Step Solution
There are 3 Steps involved in it
Step: 1

Get Instant Access to Expert-Tailored Solutions
See step-by-step solutions with expert insights and AI powered tools for academic success
Step: 2

Step: 3

Ace Your Homework with AI
Get the answers you need in no time with our AI-driven, step-by-step assistance
Get Started


