Question
1.a) The Green Revolution had a major impact on the productivity of agriculture in many lower income developing countries, including India and Pakistan. A report
1.a) The Green Revolution had a major impact on the productivity of agriculture in many lower income developing countries, including India and Pakistan. A report compiled by the National Academy of Sciences found that Impact on Productivity was substantial for rural areas, where a large percentage of the population lived back in 1960. and Food Prices."The rapid increase in agricultural output resulting from the GR (Green Revolution) came from an impressive increase in yields per hectare .Between 1960 and 2000, yields for all developing countries rose 208% for wheat,109% for rice, 157% for maize, 78% for potatoes, and 36% for cassava." This means that by by 2000, a farmer's field produced three times the wheat it did back in 1960. You may assume this is the only event affecting the nearby city.
Which one or more of the following responses help explain the impact of this development on the city?
a. The city's equilibrium population rises.
b. The city's equilibrium population falls.
c. The city's equilibrium wage rises.
d. The city's equilibrium wage falls.
e. The city's equilibrium level of utility rises.
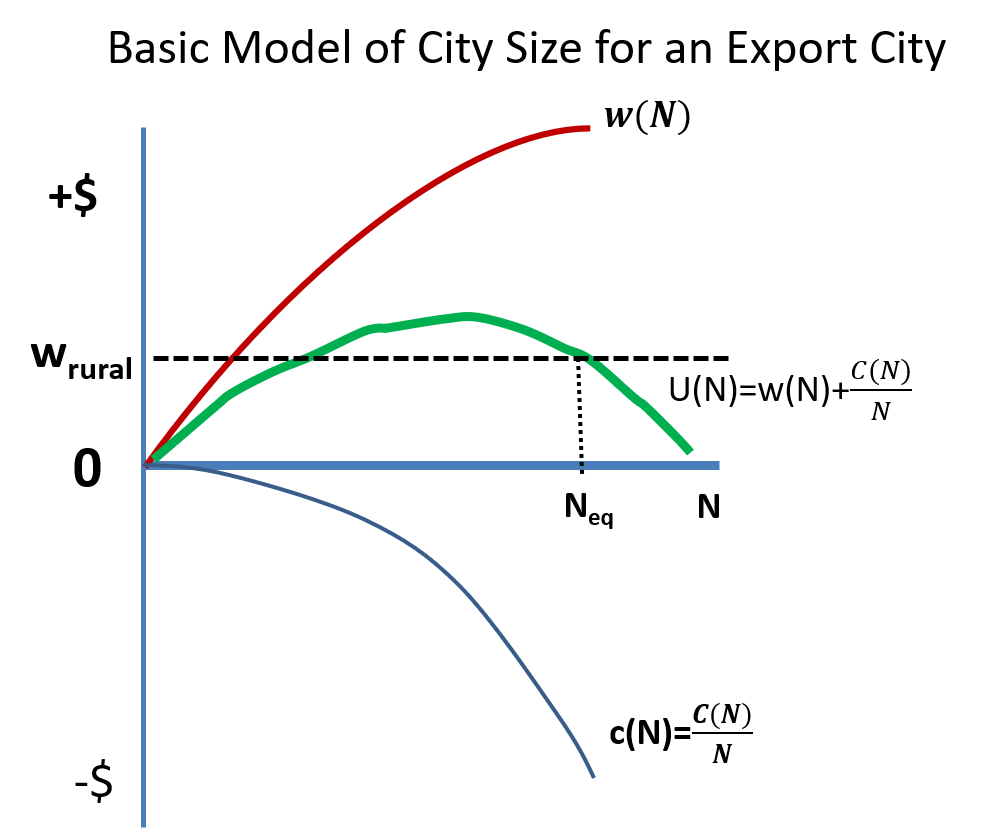
f. The city's equilibrium level of utility falls. 1.b) A challenging part of the export city model is understanding the congestion cost curve. Here is the basic graph of the model:  During the 2000s, Bangalore rapidly became the center of India's high-tech industry as new industries were developed and agglomeration economies were realized. It also benefited from outsourcing of many office functions from the USA to India. Assume that nothing else influenced the equilibrium population of Bangalore except for this change. Which one of the following response best describes how the export city model would account for changes in Bangalore?
a. w(N) shifts up but c(N) is unchanged (move along and down the congestion cost function). N rises. Utility returns to wrural
b. w(N) shifts up and c(N) shifts down to just offset the higher productivity. N does not change.
c. w(N) shifts up and c(N) shifts up because of higher costs. N does not change.
d. w(N) stays the same and c(N) shifts up because of higher costs. N falls
e. w(N) stays the same and c(N) shifts down because of higher costs. N stays the same
Basic Model of City Size for an Export City W(N) +$ Wrural C(N) U(N)=w(N)+ N 0 Nea N CIN)=C(N) N is Basic Model of City Size for an Export City W(N) +$ Wrural C(N) U(N)=w(N)+ N 0 Nea N CIN)=C(N) N isStep by Step Solution
There are 3 Steps involved in it
Step: 1

Get Instant Access to Expert-Tailored Solutions
See step-by-step solutions with expert insights and AI powered tools for academic success
Step: 2

Step: 3

Ace Your Homework with AI
Get the answers you need in no time with our AI-driven, step-by-step assistance
Get Started


