1A.Graph that should be displayed for both questions: 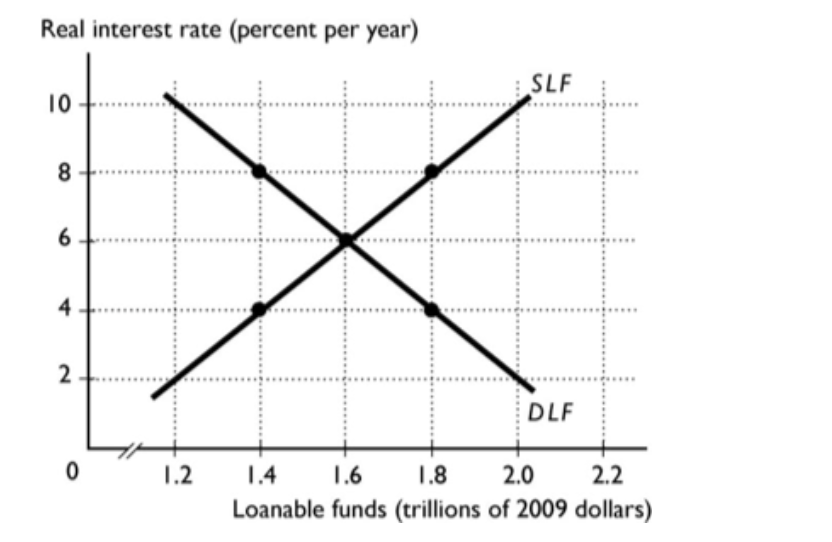
1B. 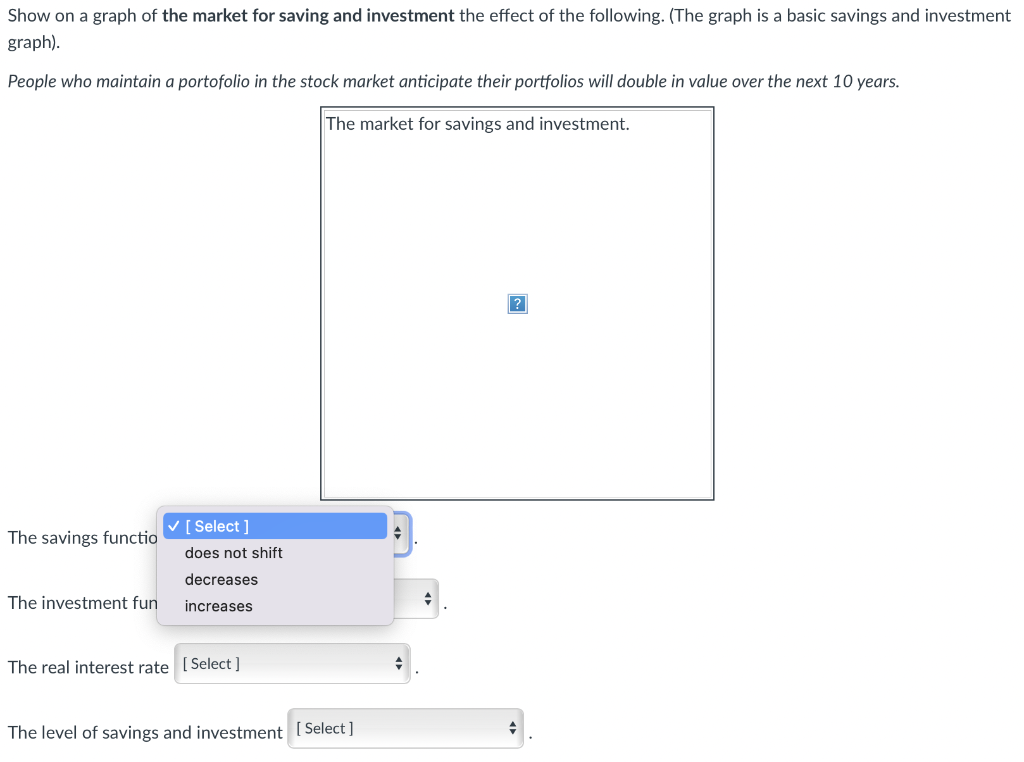
1C. 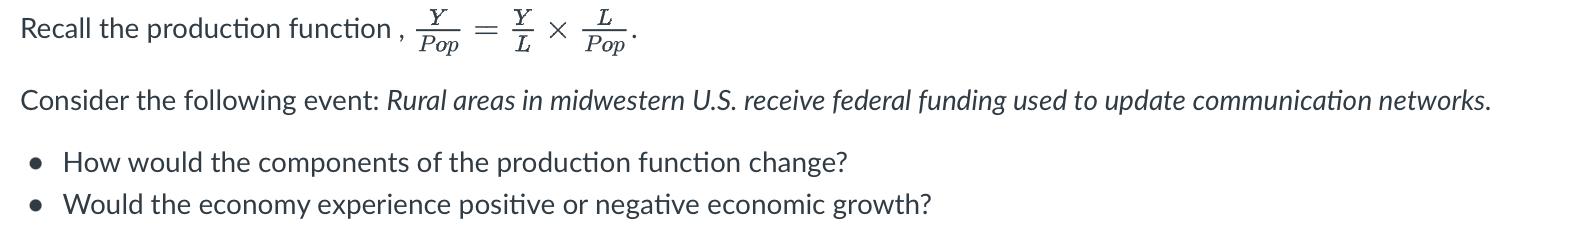
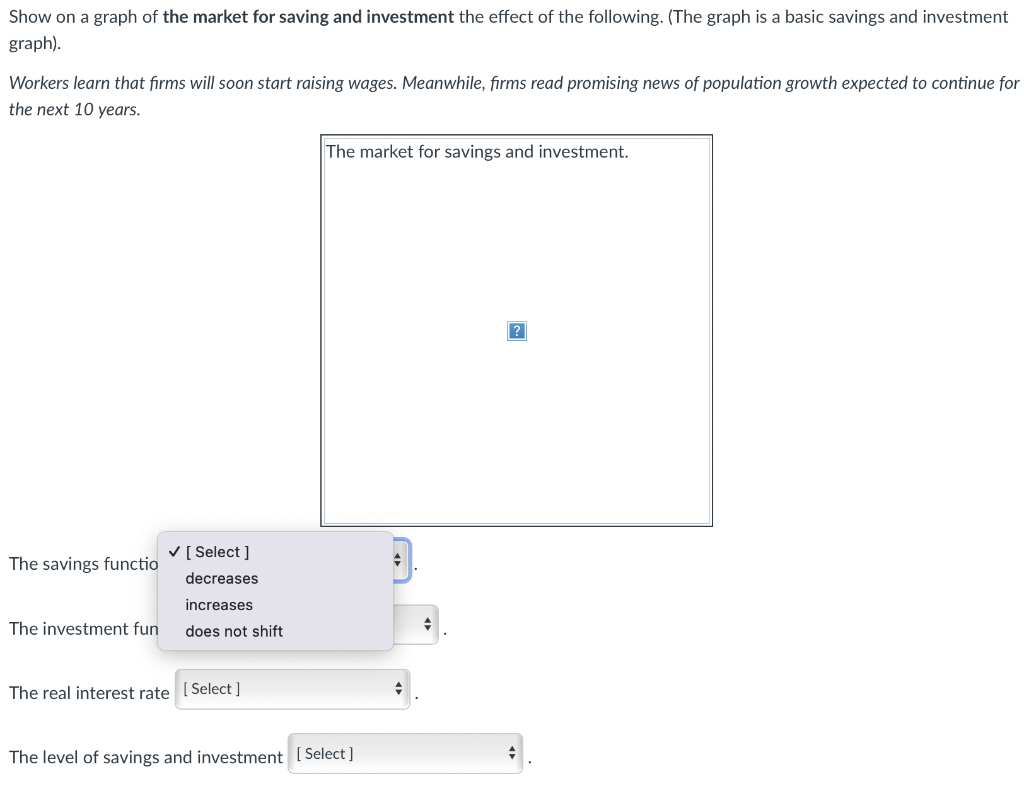
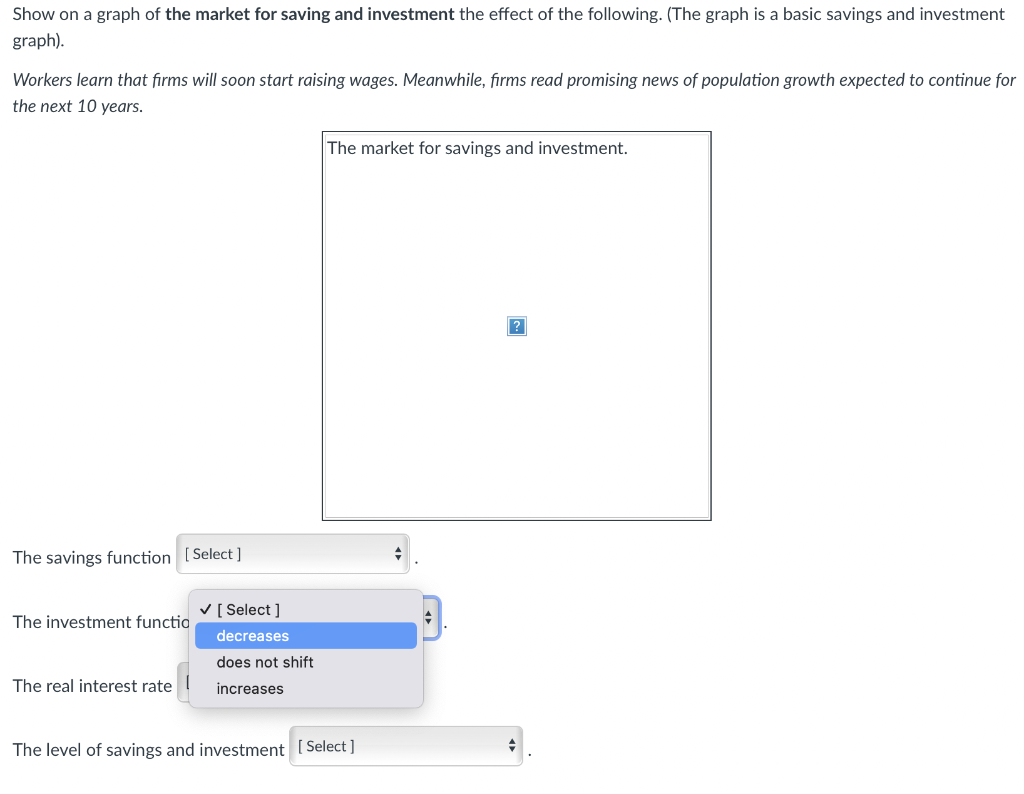
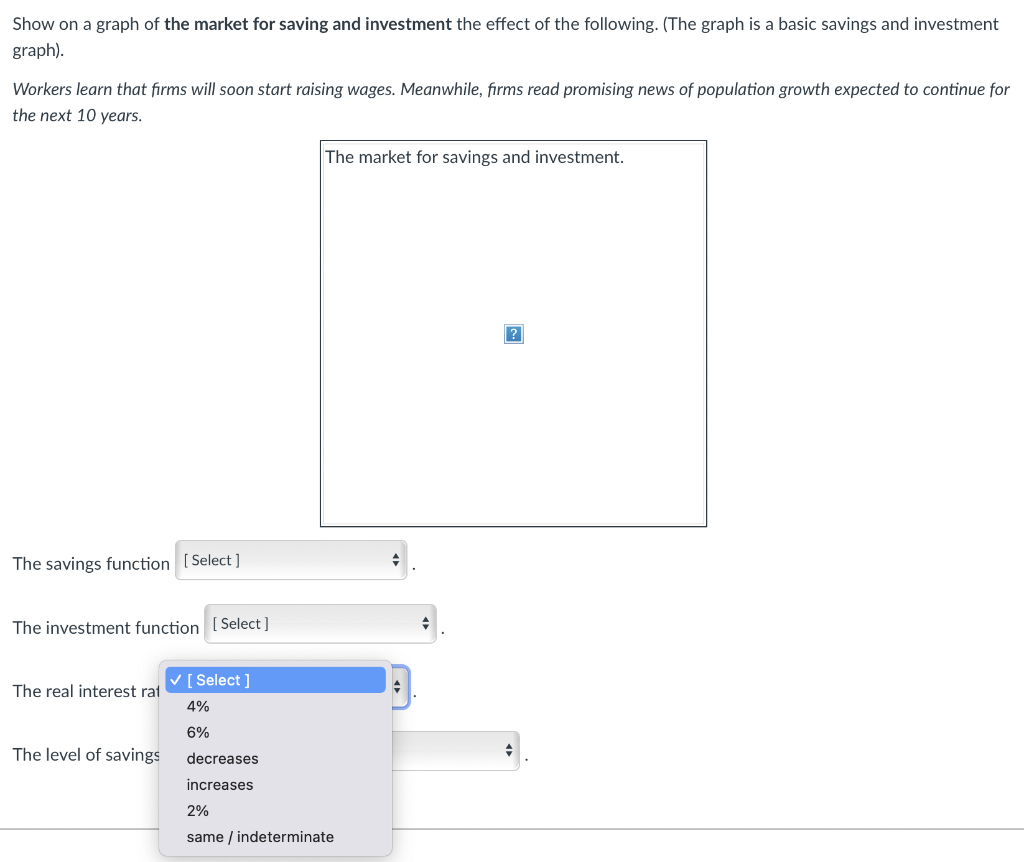
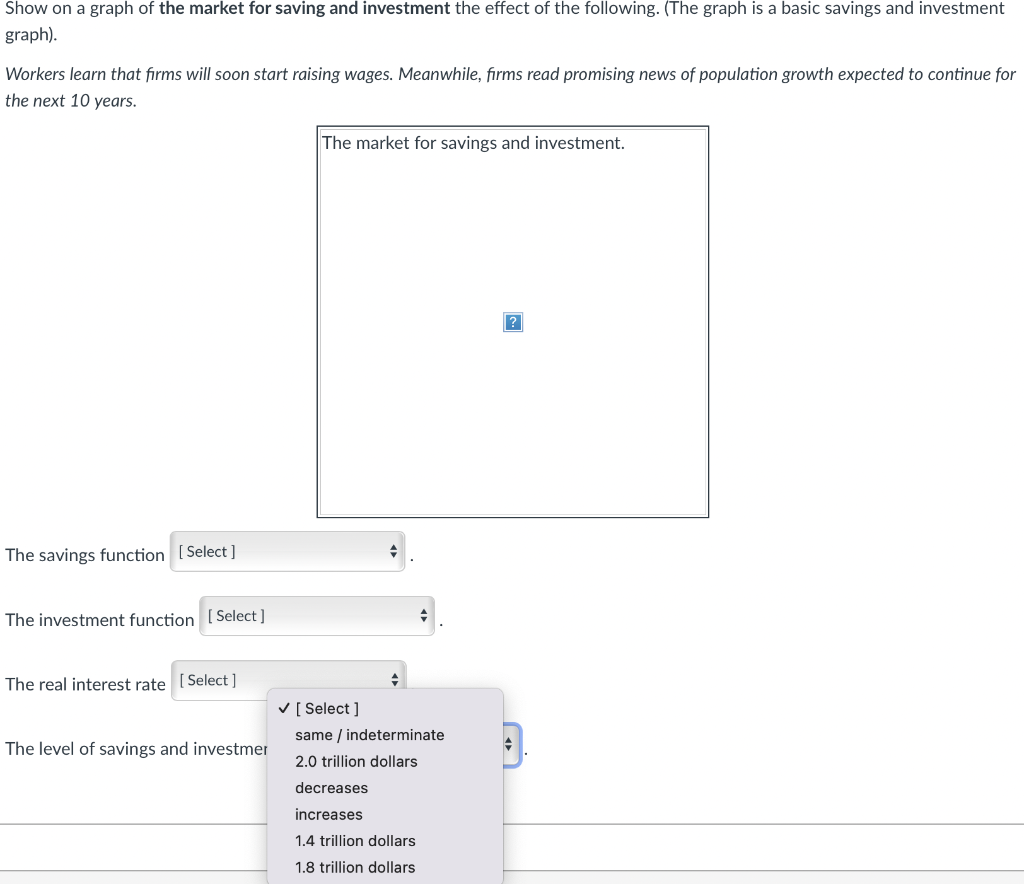
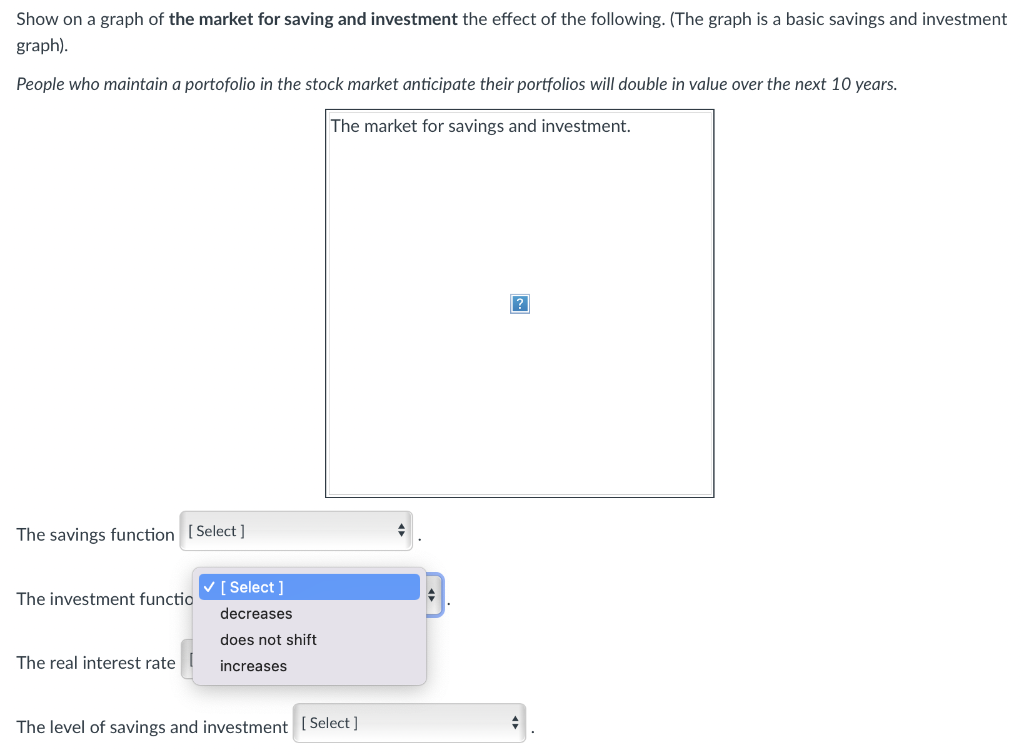
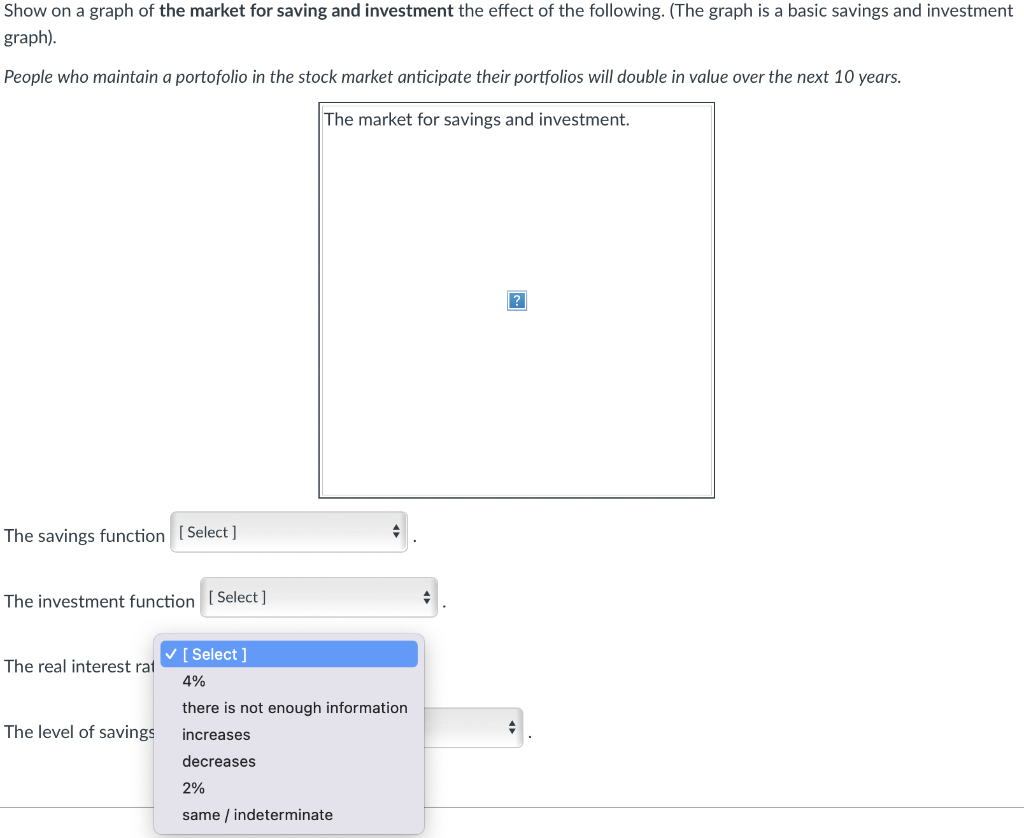
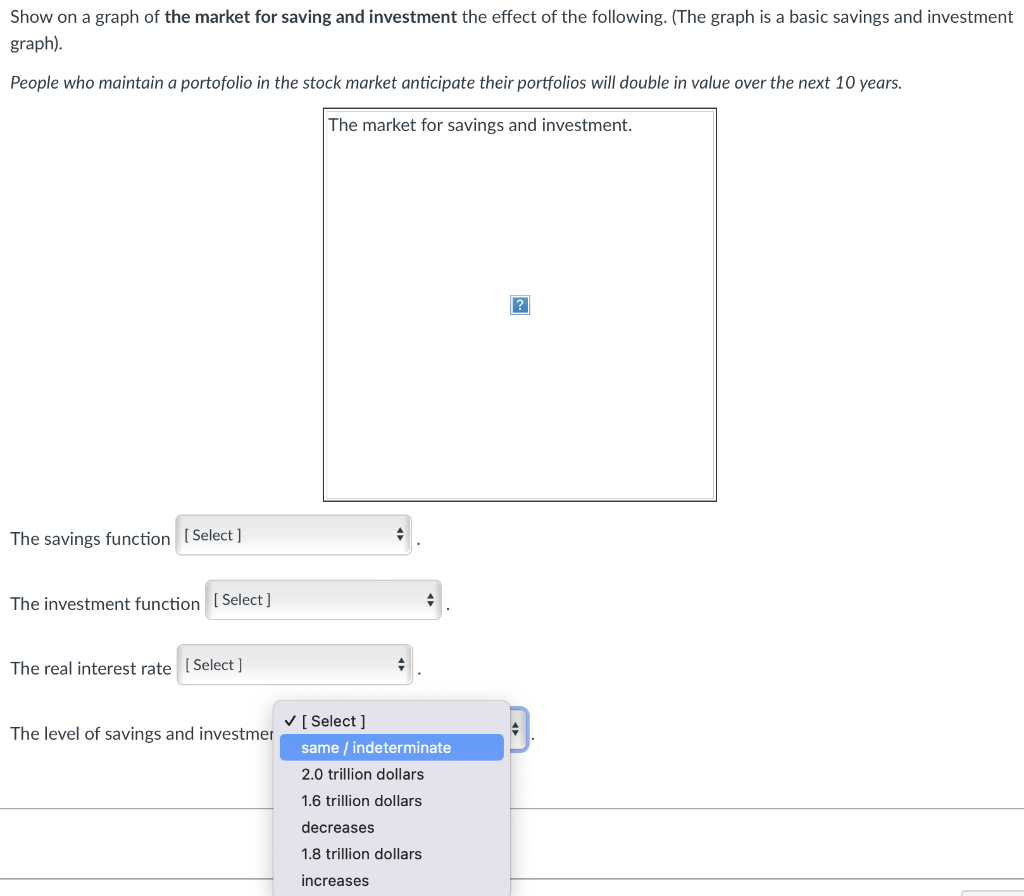
Real interest rate (percent per year) Show on a graph of the market for saving and investment the effect of the following. (The graph is a basic savings and investment graph). Workers learn that firms will soon start raising wages. Meanwhile, firms read promising news of population growth expected to continue for the next 10 years. Show on a graph of the market for saving and investment the effect of the following. (The graph is a basic savings and investment graph). Workers learn that firms will soon start raising wages. Meanwhile, firms read promising news of population growth expected to continue for the next 10 years. The market for savings and investment. The savings function The investment functic The real interest rate The level of savings and investment Show on a graph of the market for saving and investment the effect of the following. (The graph is a basic savings and investment graph). Workers learn that firms will soon start raising wages. Meanwhile, firms read promising news of population growth expected to continue for the next 10 years. The market for savings and investment. The savings function The investment function The real interest rat The level of savings Show on a graph of the market for saving and investment the effect of the following. (The graph is a basic savings and investment graph). Workers learn that firms will soon start raising wages. Meanwhile, firms read promising news of population growth expected to continue for the next 10 years. Show on a graph of the market for saving and investment the effect of the following. (The graph is a basic savings and investment graph). People who maintain a portofolio in the stock market anticipate their portfolios will double in value over the next 10 years. The savings functio The investment fun Show on a graph of the market for saving and investment the effect of the following. (The graph is a basic savings and investment graph). People who maintain a portofolio in the stock market anticipate their portfolios will double in value over the next 10 years. The savings function The investment functio The real interest rate The level of savings and investment Show on a graph of the market for saving and investment the effect of the following. (The graph is a basic savings and investment graph). People who maintain a portofolio in the stock market anticipate their portfolios will double in value over the next 10 years. The market for savings and investment. The savings function The investment function The real interest rat The level of savings Show on a graph of the market for saving and investment the effect of the following. (The graph is a basic savings and investment graph). People who maintain a portofolio in the stock market anticipate their portfolios will double in value over the next 10 years. The market for savings and investment. The savings function The investment function The real interest rate The level of savings and investmer Recall the production function,PopY=LYPopL. Consider the following event: Rural areas in midwestern U.S. receive federal funding used to update communication networks. - How would the components of the production function change? - Would the economy experience positive or negative economic growth? Real interest rate (percent per year) Show on a graph of the market for saving and investment the effect of the following. (The graph is a basic savings and investment graph). Workers learn that firms will soon start raising wages. Meanwhile, firms read promising news of population growth expected to continue for the next 10 years. Show on a graph of the market for saving and investment the effect of the following. (The graph is a basic savings and investment graph). Workers learn that firms will soon start raising wages. Meanwhile, firms read promising news of population growth expected to continue for the next 10 years. The market for savings and investment. The savings function The investment functic The real interest rate The level of savings and investment Show on a graph of the market for saving and investment the effect of the following. (The graph is a basic savings and investment graph). Workers learn that firms will soon start raising wages. Meanwhile, firms read promising news of population growth expected to continue for the next 10 years. The market for savings and investment. The savings function The investment function The real interest rat The level of savings Show on a graph of the market for saving and investment the effect of the following. (The graph is a basic savings and investment graph). Workers learn that firms will soon start raising wages. Meanwhile, firms read promising news of population growth expected to continue for the next 10 years. Show on a graph of the market for saving and investment the effect of the following. (The graph is a basic savings and investment graph). People who maintain a portofolio in the stock market anticipate their portfolios will double in value over the next 10 years. The savings functio The investment fun Show on a graph of the market for saving and investment the effect of the following. (The graph is a basic savings and investment graph). People who maintain a portofolio in the stock market anticipate their portfolios will double in value over the next 10 years. The savings function The investment functio The real interest rate The level of savings and investment Show on a graph of the market for saving and investment the effect of the following. (The graph is a basic savings and investment graph). People who maintain a portofolio in the stock market anticipate their portfolios will double in value over the next 10 years. The market for savings and investment. The savings function The investment function The real interest rat The level of savings Show on a graph of the market for saving and investment the effect of the following. (The graph is a basic savings and investment graph). People who maintain a portofolio in the stock market anticipate their portfolios will double in value over the next 10 years. The market for savings and investment. The savings function The investment function The real interest rate The level of savings and investmer Recall the production function,PopY=LYPopL. Consider the following event: Rural areas in midwestern U.S. receive federal funding used to update communication networks. - How would the components of the production function change? - Would the economy experience positive or negative economic growth