

Question
1.Bar chart of the Modulus for the six heat treatments with vertical standard deviation error bars using all the available data. For full credit include
 1.Bar chart of the Modulus for the six heat treatments with vertical standard deviation error bars using all the available data. For full credit include figure numbers and titles, axis labels with units, figure numbers and descriptions captions.
2. Use ANOVA analysis to test if six different heat treatments had an effect on the Modulus. Present your table for the ANOVA Test in the space given below. 3. Use the Multiple Range Test to test if six different heat treatments had an effect on the Modulus. Present your Multiple Range Test table in the space given below.
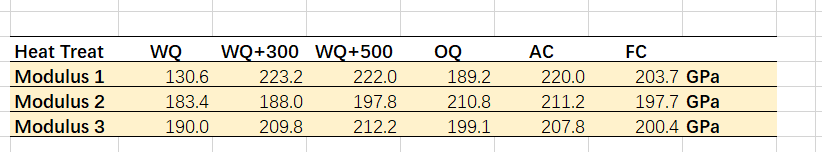
Heat Treat Modulus 1 Modulus 2 Modulus 3 WQ 130.6 183.4 190.0 WQ+300 WQ+500 223.2 222.0 188.0 197.8 209.8 212.2 OQ 189.2 210.8 199.1 AC 220.0 211.2 207.8 FC 203.7 GPa 197.7 GPS 200.4 GPa Heat Treat Modulus 1 Modulus 2 Modulus 3 WQ 130.6 183.4 190.0 WQ+300 WQ+500 223.2 222.0 188.0 197.8 209.8 212.2 OQ 189.2 210.8 199.1 AC 220.0 211.2 207.8 FC 203.7 GPa 197.7 GPS 200.4 GPaStep by Step Solution
There are 3 Steps involved in it
Step: 1

Get Instant Access to Expert-Tailored Solutions
See step-by-step solutions with expert insights and AI powered tools for academic success
Step: 2

Step: 3
Ace Your Homework with AI
Get the answers you need in no time with our AI-driven, step-by-step assistance
Get Started
The International Corporate Governance System Audit Roles And Board Oversight
Authors: F. Lessambo
1st Edition
134947178X, 978-1349471782