

Question
1.Comment on the management's ability to manage the accounts receivable over the past two years. 2. What is a possible explanation for the decrease to
1.Comment on the management's ability to manage the accounts receivable over the past two years.
2. What is a possible explanation for the decrease to the Wages and Salaries expense?
3. Explain the reason for the increase to the bank loan.
4. Comment on the current ratio. Is is good/bad? Why
5. Using all the information, make comments about the companys
overall performance over the past 2 years. /10
Complete this question using point form but fully justify your
findings.
Comment on liquidity, solvency, and profitability
Would you recommend with company to investors?
RETURN OF EQUITY IS 12.7%
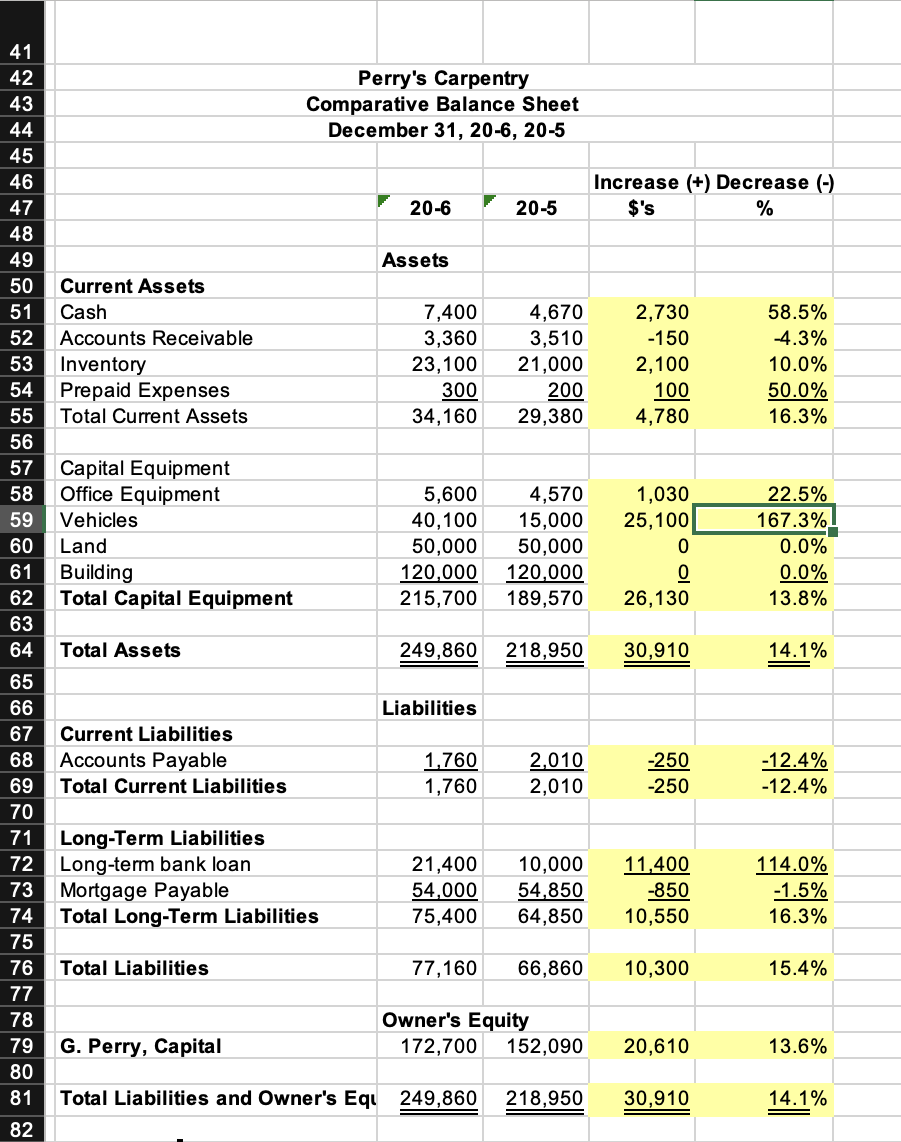
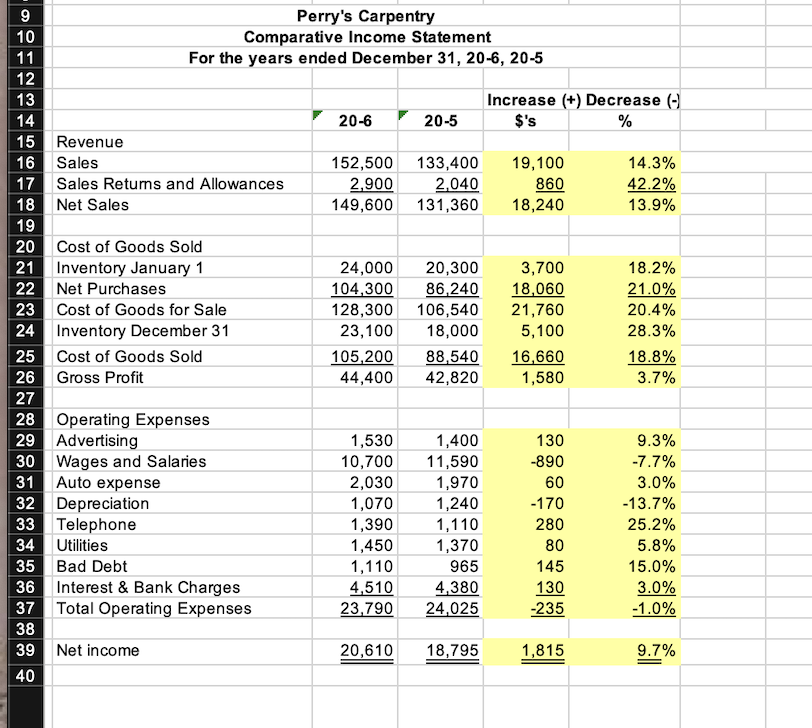
Perry's Carpentry Comparative Balance Sheet December 31, 20-6, 20-5 Increase (+) Decrease (-) $'s % 20-6 20-5 Assets Current Assets Cash Accounts Receivable Inventory Prepaid Expenses Total Current Assets 7,400 3,360 23,100 300 34,160 4,670 3,510 21,000 200 29,380 2,730 -150 2,100 100 4,780 58.5% -4.3% 10.0% 50.0% 16.3% 41 42 43 44 45 46 47 48 49 50 51 52 53 54 55 56 57 58 59 60 61 62 63 64 65 66 67 68 69 70 71 72 73 74 75 76 77 78 79 80 81 Capital Equipment Office Equipment Vehicles Land Building Total Capital Equipment 5,600 40,100 50,000 120,000 215,700 4,570 15,000 50,000 120,000 189,570 1,030 25,100 0 0 26,130 22.5% 167.3% 0.0% 0.0% 13.8% Total Assets 249,860 218,950 30,910 14.1% Liabilities Current Liabilities Accounts Payable Total Current Liabilities 1,760 1,760 2,010 2,010 -250 -250 -12.4% -12.4% Long-Term Liabilities Long-term bank loan Mortgage Payable Total Long-Term Liabilities 21,400 54,000 75,400 10,000 54,850 64,850 11,400 -850 10,550 114.0% -1.5% 16.3% Total Liabilities 77,160 66,860 10,300 15.4% Owner's Equity 172,700 152,090 G. Perry, Capital 20,610 13.6% Total Liabilities and Owner's Eqi 249,860 218,950 30,910 14.1% 82 17 9 Perry's Carpentry 10 Comparative Income Statement 11 For the years ended December 31, 20-6, 20-5 12 13 Increase (+) Decrease (-) 14 20-6 20-5 $'s % 15 Revenue 16 Sales 152,500 133,400 19,100 14.3% Sales Returns and Allowances 2,900 2,040 860 42.2% 18 Net Sales 149,600 131,360 18,240 13.9% 19 20 Cost of Goods Sold 21 Inventory January 1 24,000 20,300 3,700 18.2% 22 Net Purchases 104,300 86,240 18,060 21.0% 23 Cost of Goods for Sale 128,300 106,540 21,760 20.4% 24 Inventory December 31 23,100 18,000 5,100 28.3% 25 Cost of Goods Sold 105,200 88,540 16,660 18.8% 26 Gross Profit 44,400 42,820 1,580 3.7% 27 28 Operating Expenses 29 Advertising 1,530 1,400 130 9.3% 30 Wages and Salaries 10,700 11,590 -890 -7.7% 31 Auto expense 2,030 1,970 60 3.0% 32 Depreciation 1,070 1,240 -170 -13.7% 33 Telephone 1,390 1,110 280 25.2% Utilities 1,450 1,370 80 5.8% 35 Bad Debt 1,110 965 145 15.0% 36 Interest & Bank Charges 4,510 4,380 130 3.0% 37 Total Operating Expenses 23,790 24,025 -235 -1.0% 34 38 Net income 20,610 18,795 1,815 9.7% 39 40Step by Step Solution
There are 3 Steps involved in it
Step: 1

Get Instant Access to Expert-Tailored Solutions
See step-by-step solutions with expert insights and AI powered tools for academic success
Step: 2

Step: 3
Ace Your Homework with AI
Get the answers you need in no time with our AI-driven, step-by-step assistance
Get Started
Fundamentals Of Public Budgeting And Finance
Authors: Aman Khan
1st Edition
3030192253, 978-3030192259