

Question
1.In this problem, assume that the distribution of differences is approximately normal. Note : For degrees of freedom d . f . not in the
1.In this problem, assume that the distribution of differences is approximately normal. Note: For degrees of freedom d.f. not in the Student's t table, use the closest d.f. that is smaller. In some situations, this choice of d.f. may increase the P-value by a small amount and therefore produce a slightly more "conservative" answer.
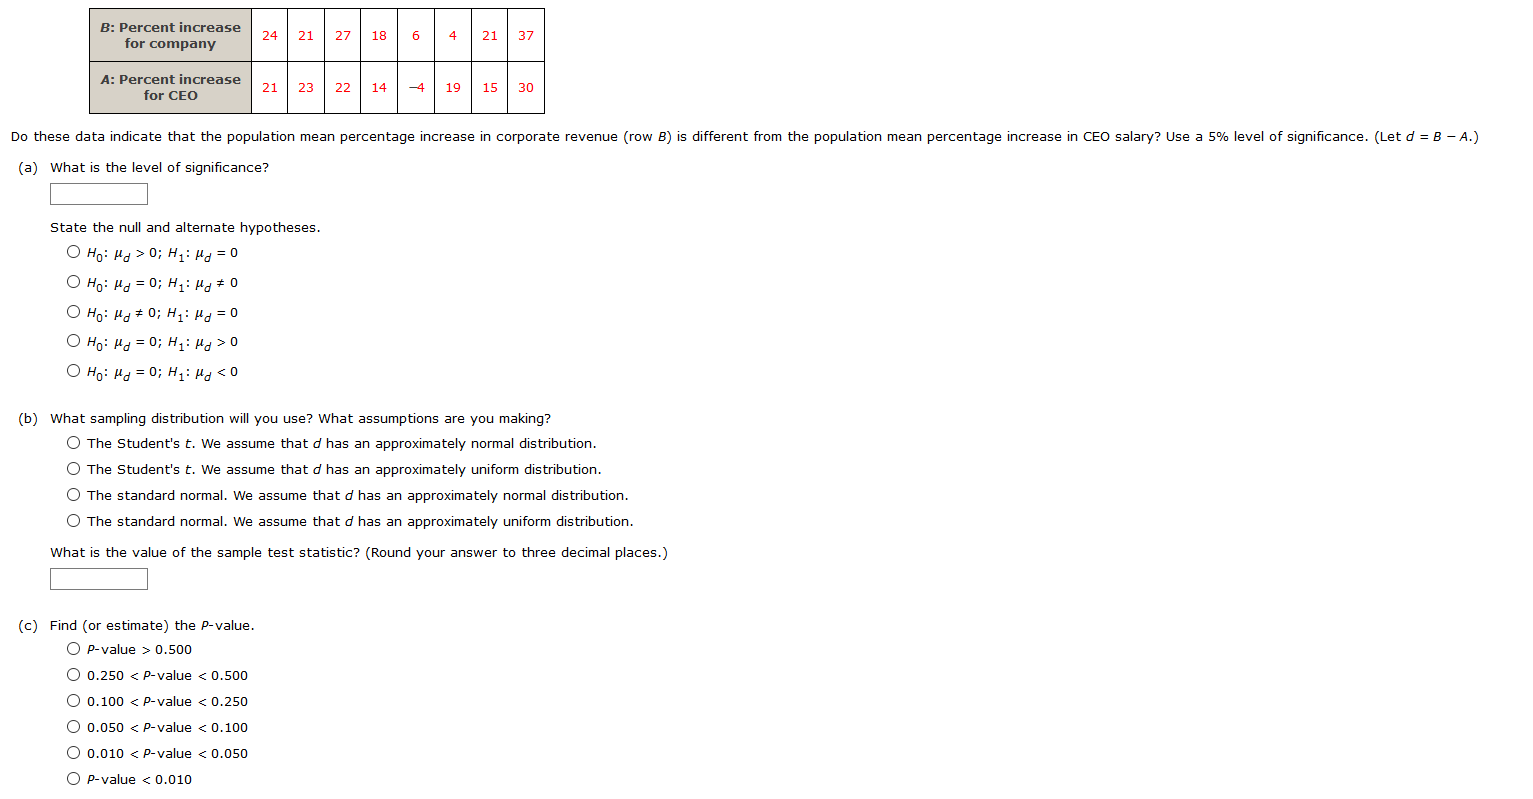
Are America's top chief executive officers (CEOs) really worth all that money? One way to answer this question is to look at row B, the annual company percentage increase in revenue, versus row A, the CEO's annual percentage salary increase in that same company. Suppose a random sample of companies yielded the following data:
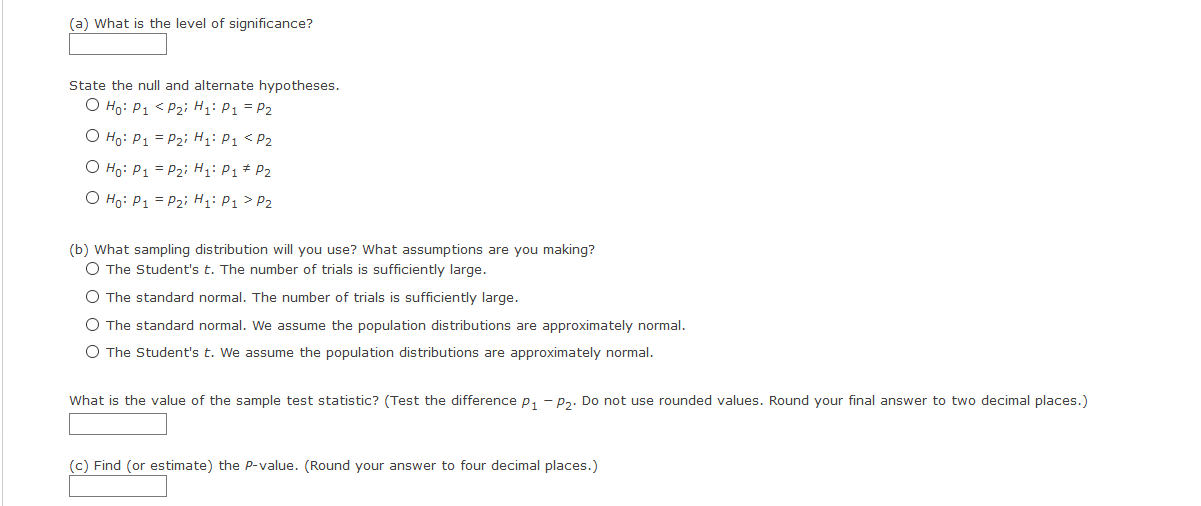
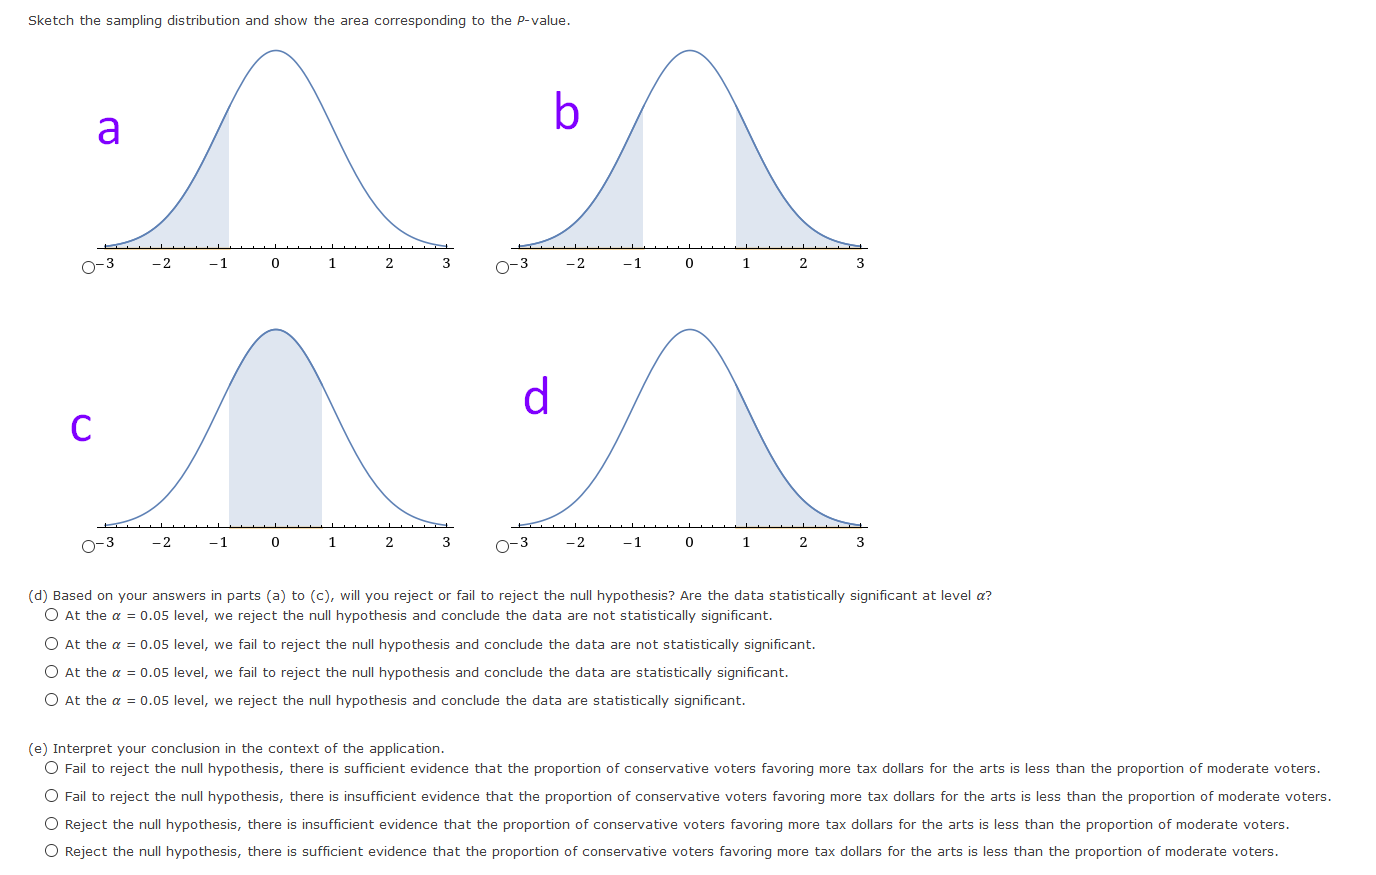
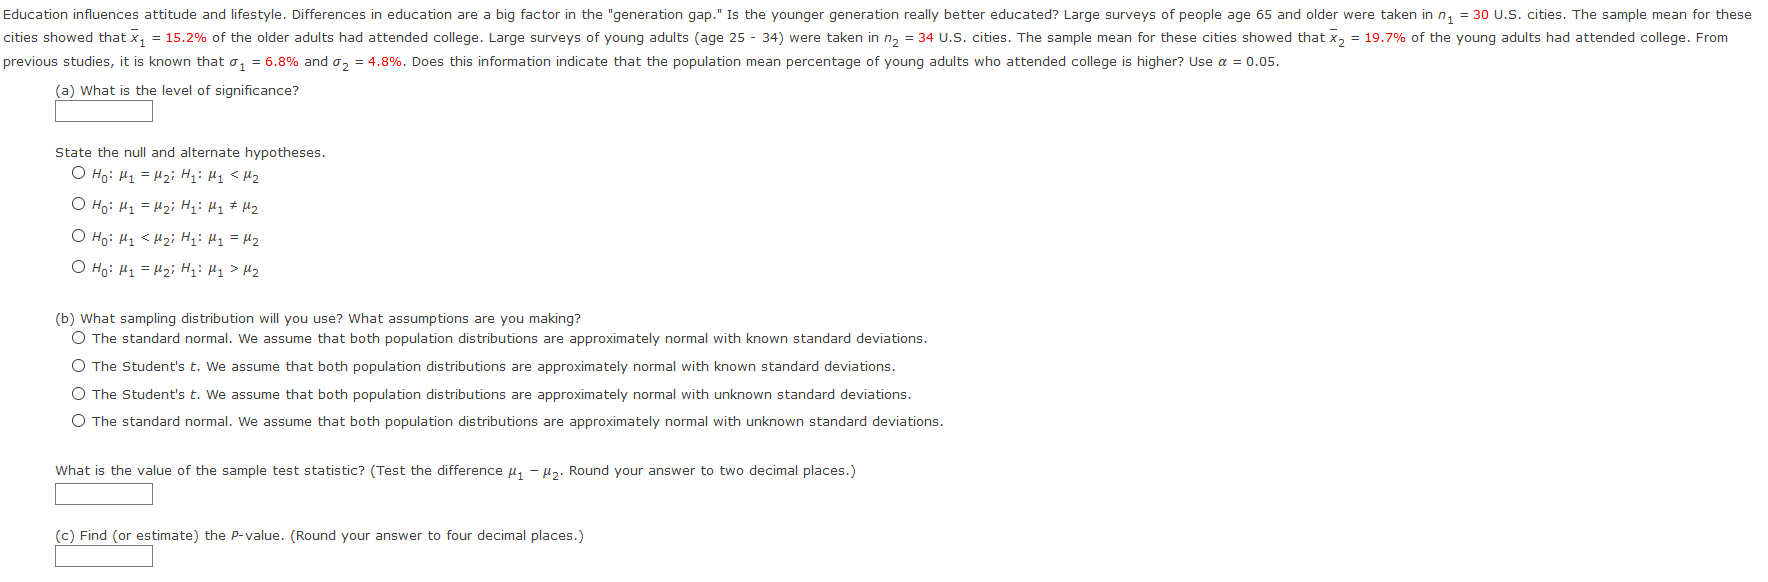
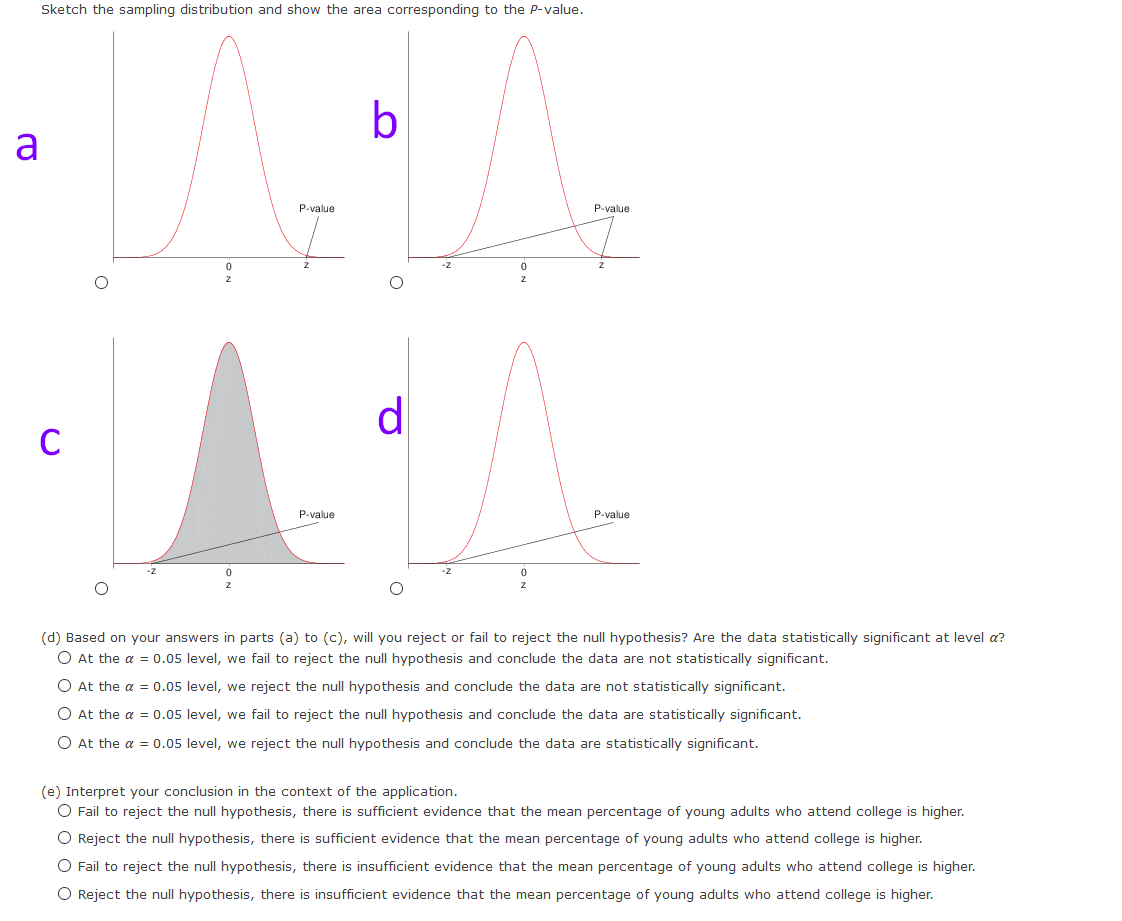
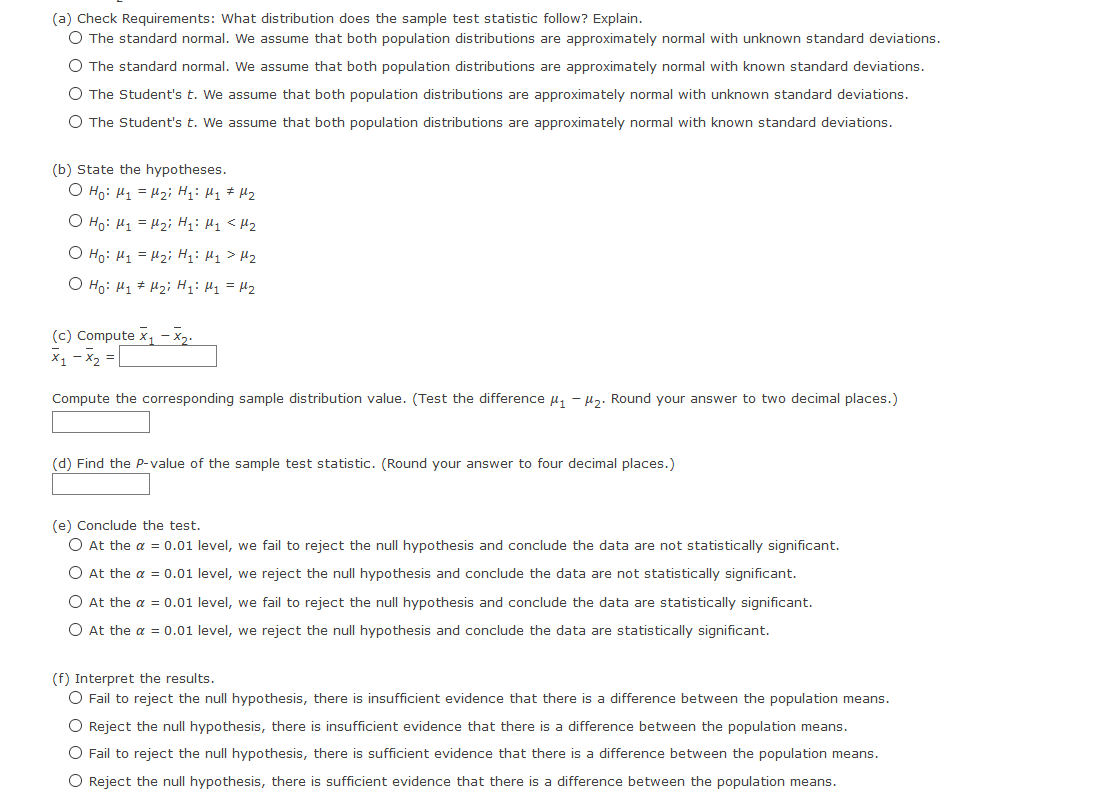
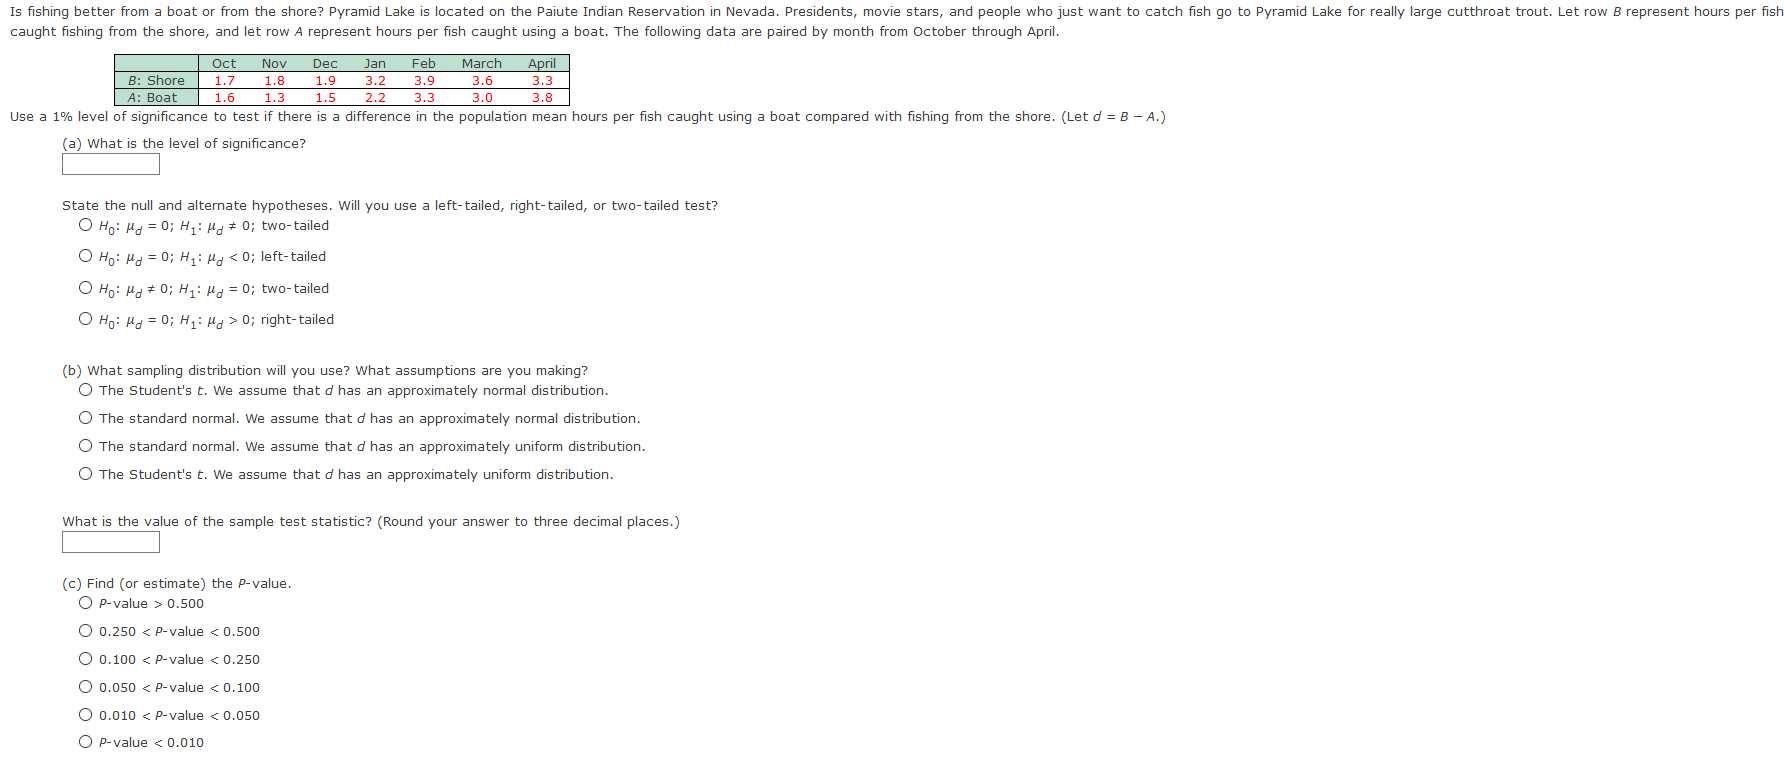
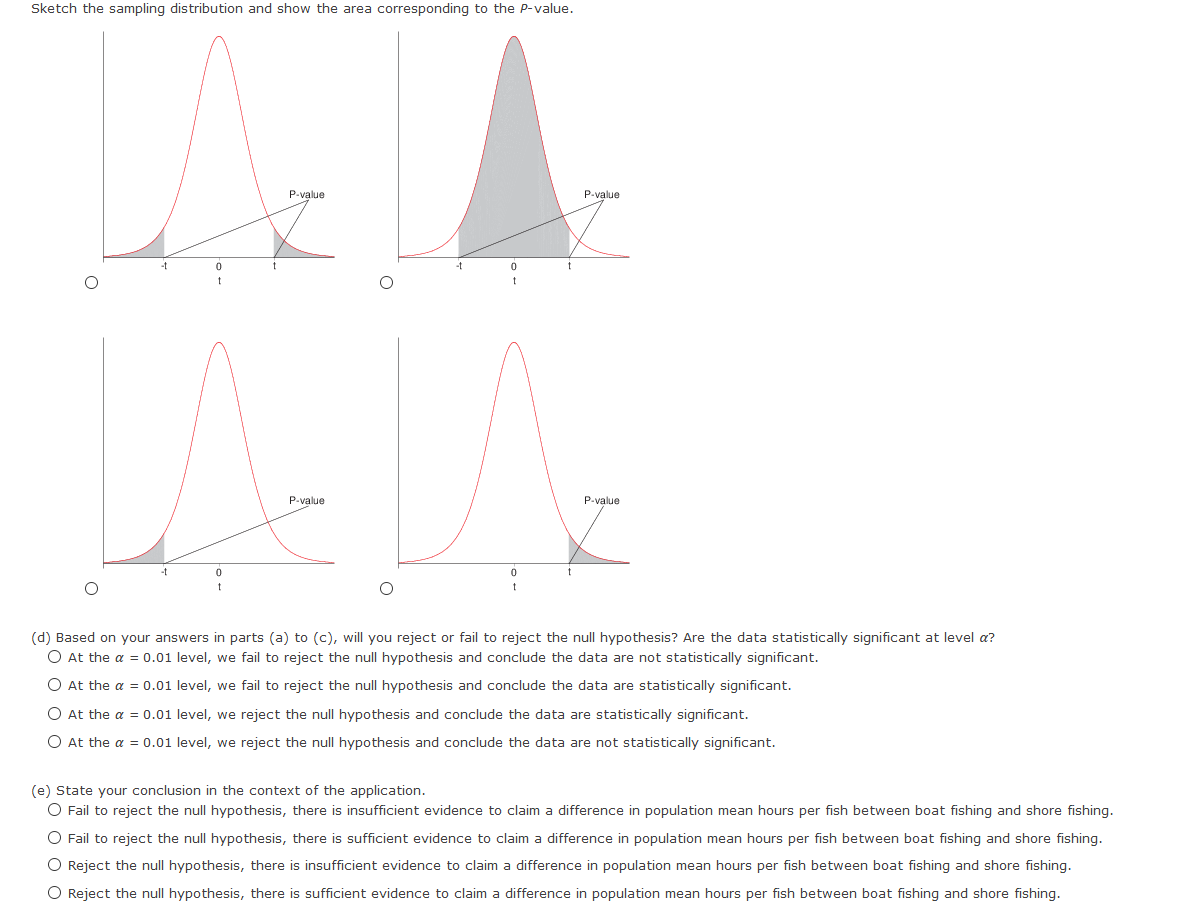
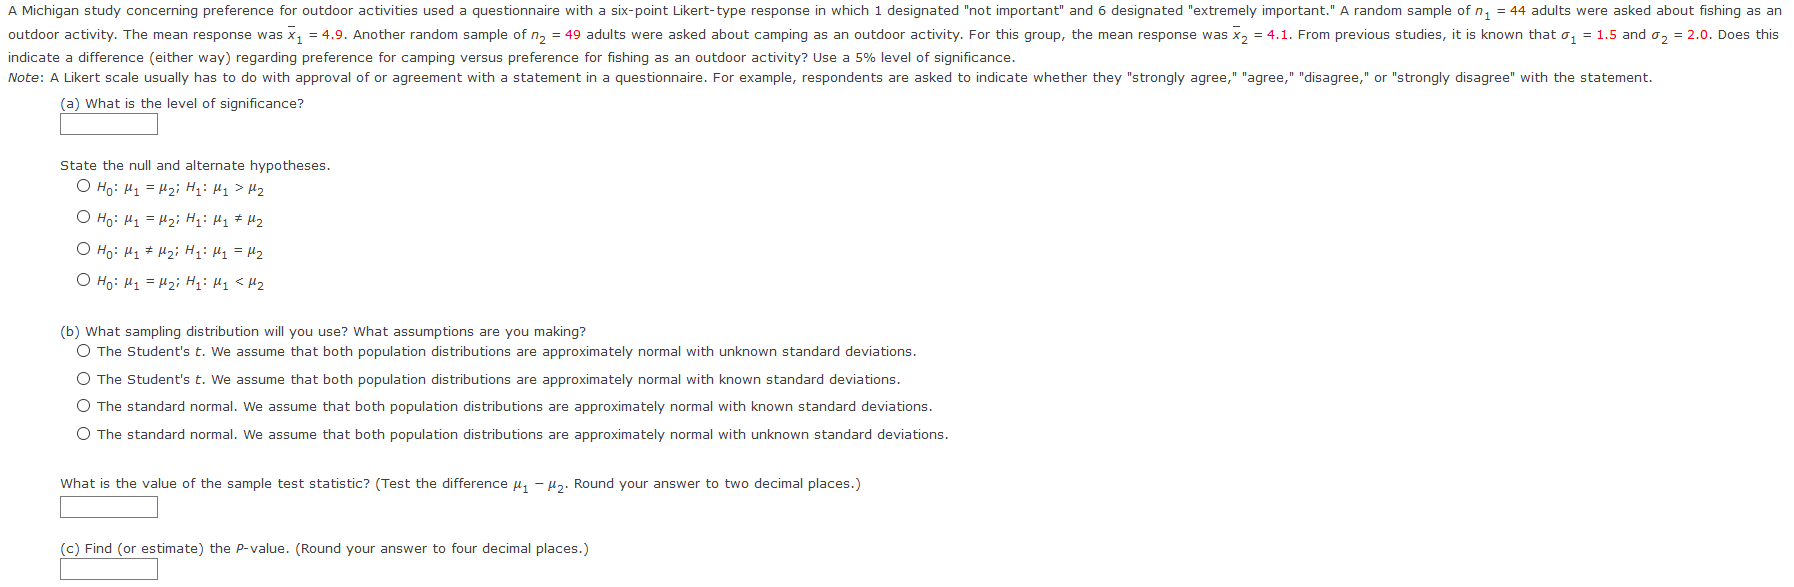
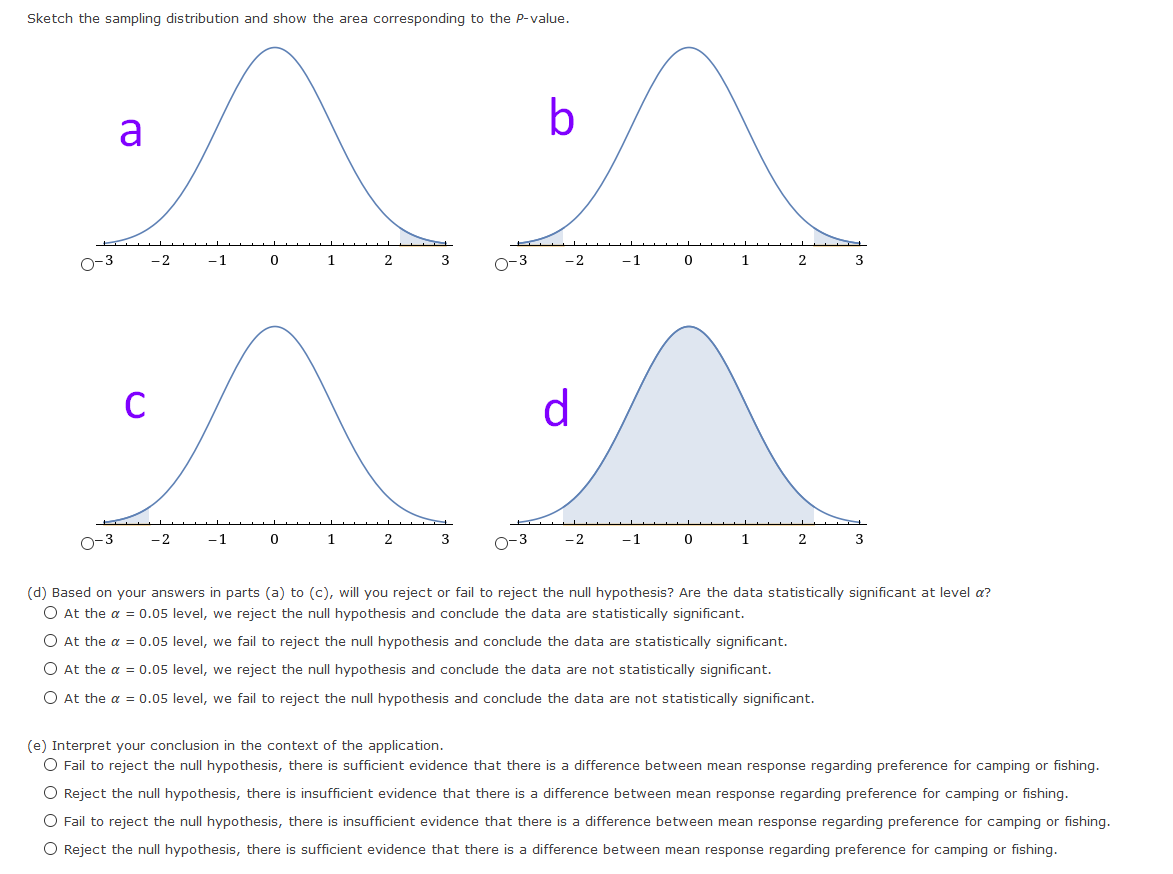
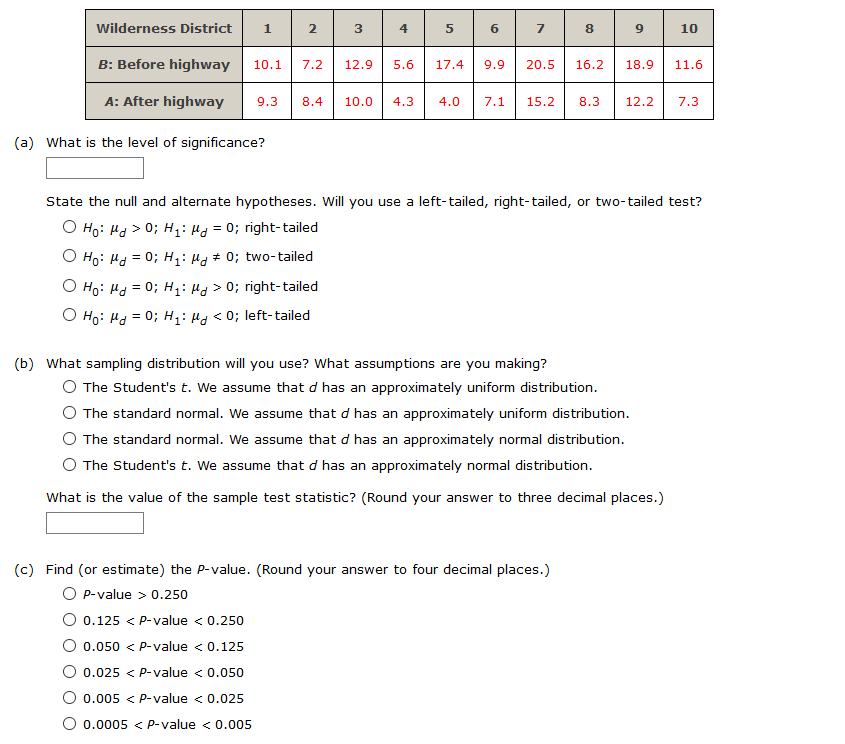
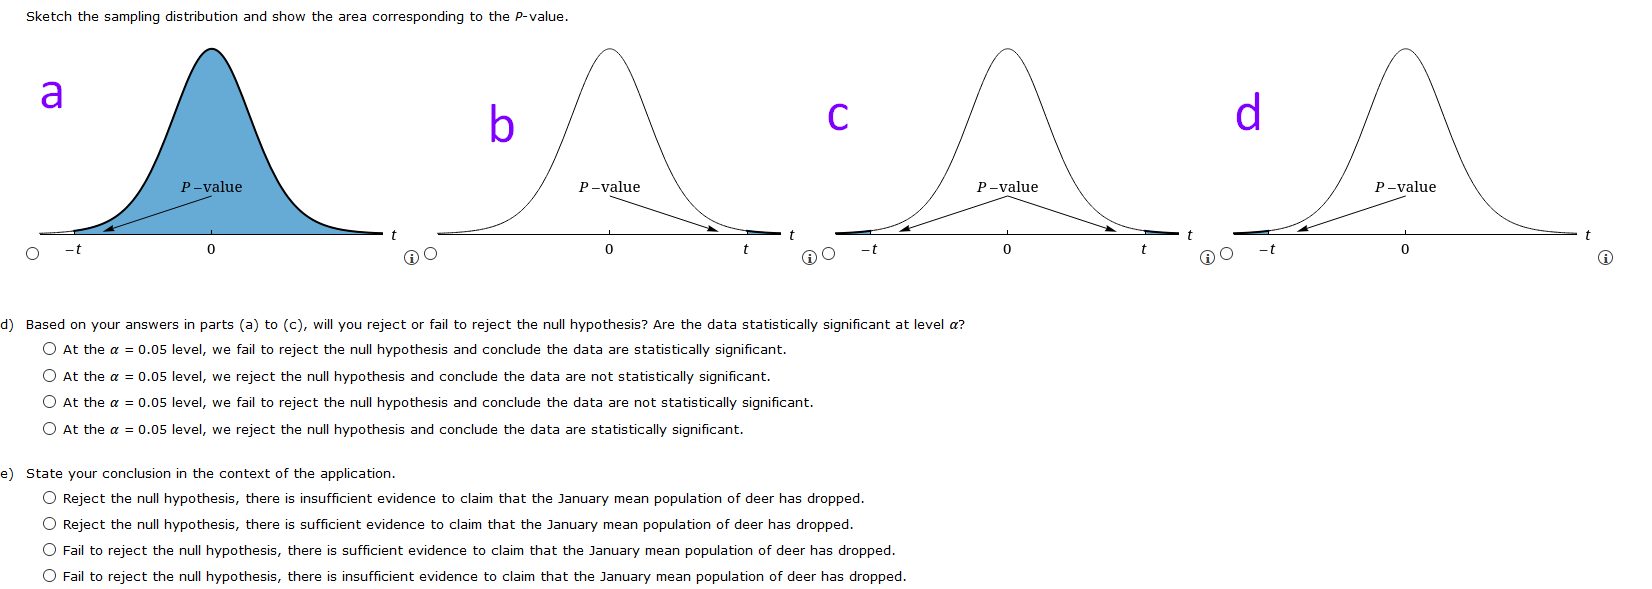
H2 (b) What sampling distribution will you use? What assumptions are you making? The standard normal. We assume that both population distributions are approximately normal with known standard deviations. O The Student's t. We assume that both population distributions are approximately normal with known standard deviations. O The Student's t. We assume that both population distributions are approximately normal with unknown standard deviations. O The standard normal. We assume that both population distributions are approximately normal with unknown standard deviations. What is the value of the sample test statistic? (Test the difference #1 - #2. Round your answer to two decimal places.) (c) Find (or estimate) the P-value. (Round your answer to four decimal places.)Sketch the sampling distribution and show the area corresponding to the P-value. b a P-value P-value -Z NO NO O O C P-value P-value NO NO (d) Based on your answers in parts (a) to (c), will you reject or fail to reject the null hypothesis? Are the data statistically significant at level a? O At the a = 0.05 level, we fail to reject the null hypothesis and conclude the data are not statistically significant. O At the a = 0.05 level, we reject the null hypothesis and conclude the data are not statistically significant. O At the a = 0.05 level, we fail to reject the null hypothesis and conclude the data are statistically significant. At the a = 0.05 level, we reject the null hypothesis and conclude the data are statistically significant. (e) Interpret your conclusion in the context of the application. O Fail to reject the null hypothesis, there is sufficient evidence that the mean percentage of young adults who attend college is higher. O Reject the null hypothesis, there is sufficient evidence that the mean percentage of young adults who attend college is higher. Fail to reject the null hypothesis, there is insufficient evidence that the mean percentage of young adults who attend college is higher. O Reject the null hypothesis, there is insufficient evidence that the mean percentage of young adults who attend college is higher.(a) Check Requirements: What distribution does the sample test statistic follow? Explain. O The standard normal. We assume that both population distributions are approximately normal with unknown standard deviations. The standard normal. We assume that both population distributions are approximately normal with known standard deviations. The Student's t. We assume that both population distributions are approximately normal with unknown standard deviations. O The Student's t. We assume that both population distributions are approximately normal with known standard deviations. (b) State the hypotheses. O Ho: H1 = #2i H1: H1 * Hz O Ho: H1 = #2i H1: H1 = Hz O Ho : H1 = #2; H1: H1 > Hz O Ho: H1 # Hzi H1: M1 = Hz (c) Compute X 1 - X2. * 1 - * 2 = Compute the corresponding sample distribution value. (Test the difference #1 - #2. Round your answer to two decimal places.) 'd) Find the P-value of the sample test statistic. (Round your answer to four decimal places.) (e) Conclude the test. O At the a = 0.01 level, we fail to reject the null hypothesis and conclude the data are not statistically significant. O At the a = 0.01 level, we reject the null hypothesis and conclude the data are not statistically significant. O At the a = 0.01 level, we fail to reject the null hypothesis and conclude the data are statistically significant. O At the a = 0.01 level, we reject the null hypothesis and conclude the data are statistically significant. (f) Interpret the results. O Fail to reject the null hypothesis, there is insufficient evidence that there is a difference between the population means. O Reject the null hypothesis, there is insufficient evidence that there is a difference between the population means. O Fail to reject the null hypothesis, there is sufficient evidence that there is a difference between the population means. O Reject the null hypothesis, there is sufficient evidence that there is a difference between the population means.Is fishing better from a boat or from the shore? Pyramid Lake is located on the Paiute Indian Reservation in Nevada. Presidents, movie stars, and people who just want to catch fish go to Pyramid Lake for really large cutthroat trout. Let row B represent hours per fish caught fishing from the shore, and let row A represent hours per fish caught using a boat. The following data are paired by month from October through April. Oct Nov Dec Jan Feb March April B: Shore 1.7 1.8 1.9 3.2 3.9 3.6 3.3 A: Boat 1.6 1.3 1.5 2.2 3.3 3.0 3.8 Use a 1% level of significance to test if there is a difference in the population mean hours per fish caught using a boat compared with fishing from the shore. (Let d = B - A.) (a) What is the level of significance? State the null and alternate hypotheses. Will you use a left-tailed, right-tailed, or two-tailed test? O Ho: Mg = 0; H1: My # 0; two-tailed O Ho: Mg = 0; H1: My 0; right- tailed (b) What sampling distribution will you use? What assumptions are you making? O The Student's t. We assume that d has an approximately normal distribution. O The standard normal. We assume that d has an approximately normal distribution. The standard normal. We assume that d has an approximately uniform distribution. O The Student's t. We assume that d has an approximately uniform distribution. What is the value of the sample test statistic? (Round your answer to three decimal places.) (c) Find (or estimate) the P-value. O P-value > 0.500 O 0.250 H2 O Ho: M1 = M2i H1: M1 * Hz O HO: H1 # Hzi H1: M1 = H2 O Ho: H1 = H2i H1: H1 = H2 (b) What sampling distribution will you use? What assumptions are you making? O The Student's t. We assume that both population distributions are approximately normal with unknown standard deviations. O The Student's t. We assume that both population distributions are approximately normal with known standard deviations. The standard normal. We assume that both population distributions are approximately normal with known standard deviations. The standard normal. We assume that both population distributions are approximately normal with unknown standard deviations. What is the value of the sample test statistic? (Test the difference uj - #2. Round your answer to two decimal places.) (c) Find (or estimate) the P-value. (Round your answer to four decimal places.)Sketch the sampling distribution and show the area corresponding to the P-value. a b O-3 -2 -1 0 1 2 3 O-3 -2 - 1 0 1 2 3 C O-3 -2 -1 2 O-3 -2 -1 0 1 2 (d) Based on your answers in parts (a) to (c), will you reject or fail to reject the null hypothesis? Are the data statistically significant at level a? O At the a = 0.05 level, we reject the null hypothesis and conclude the data are statistically significant. O At the a = 0.05 level, we fail to reject the null hypothesis and conclude the data are statistically significant. O At the a = 0.05 level, we reject the null hypothesis and conclude the data are not statistically significant. O At the a = 0.05 level, we fail to reject the null hypothesis and conclude the data are not statistically significant. (e) Interpret your conclusion in the context of the application. O Fail to reject the null hypothesis, there is sufficient evidence that there is a difference between mean response regarding preference for camping or fishing. O Reject the null hypothesis, there is insufficient evidence that there is a difference between mean response regarding preference for camping or fishing O Fail to reject the null hypothesis, there is insufficient evidence that there is a difference between mean response regarding preference for camping or fishing. O Reject the null hypothesis, there is sufficient evidence that there is a difference between mean response regarding preference for camping or fishing.Wilderness District 5 10 B: Before highway 10.1 7.2 12.9 5.6 17.4 9.9 20.5 16.2 18.9 11.6 A: After highway 9.3 8.4 10.0 7.3 4.0 7.1 15.2 8.3 12.2 7.3 (a) What is the level of significance? State the null and alternate hypotheses. Will you use a left-tailed, right-tailed, or two-tailed test? O Ho: My > 0; H1: My = 0; right- tailed O Ho: My = 0; H1: My # 0; two-tailed O Ho: My = 0; H1: My > 0; right- tailed O Ho: My = 0; H1: My 0.250 O 0.125
Step by Step Solution
There are 3 Steps involved in it
Step: 1

Get Instant Access to Expert-Tailored Solutions
See step-by-step solutions with expert insights and AI powered tools for academic success
Step: 2

Step: 3
Ace Your Homework with AI
Get the answers you need in no time with our AI-driven, step-by-step assistance
Get Started
Stability Analysis Of Nonlinear Systems
Authors: Vangipuram Lakshmikantham, Srinivasa Leela, Anatoly A Martynyuk
2nd Edition
3319272004, 9783319272009