

Question
1.(LSAT)The LSAT (a test taken for law school admission) has amean score of 151with astandard deviation of 9and a unimodal, symmetric distribution of scores. A
1. (LSAT) The LSAT (a test taken for law school admission) has a mean score of 151 with a standard deviation of 9 and a unimodal, symmetric distribution of scores.
- A test preparation organization teaches small classes of 9 students at a time.
- A larger organization teaches classes of 25 students at a time.
- Both organizations publish the mean scores of all their classes.
What would you expect the sampling distribution of mean class scores to be for each organization?
Organization that teaches small classes | Organization teaching larger classes |
If either organization has a graduating class with a mean score of 160, they’ll take out a full-page ad in the local school paper to advertise. Which organization is more likely to have that success? Explain.
Both organizations advertise that if any class has an average score below 145, they’ll pay for everyone to retake the LSAT. Which organization is at greater risk to have to pay?
2. Estimate the critical value of t for a C% confidence interval with with the indicated degrees of freedom.
Use Statcrunch (STAT->Calculator -> T). See the two examples below on how to get the critical values. I would do the first one. No need to copy and paste the graph. It’s just for you to see how we use this software.
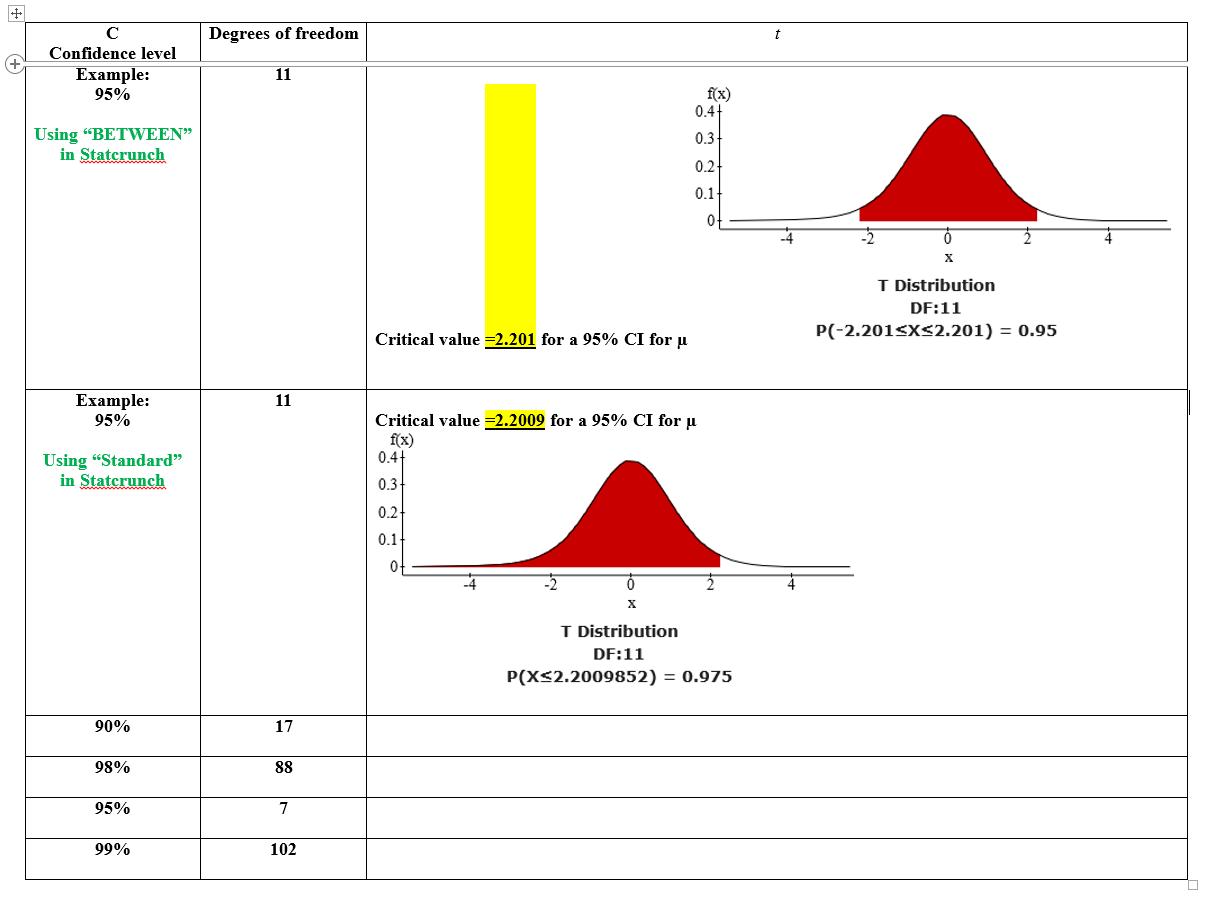
+ C Confidence level Example: 95% Using "BETWEEN" in Statcrunch Degrees of freedom 11 Example: 95% 11 Using "Standard" in Statcrunch 90% 17 98% 88 95% 7 99% 102 Critical value =2.201 for a 95% CI for Critical value =2.2009 for a 95% CI for f(x) 0.4+ 0.3 0.2 0.1 0 f(x) 0.4+ 0.3 0.2- 0.1+ x T Distribution DF:11 P(X2.2009852) = 0.975 t T Distribution DF:11 P(-2.201x2.201) = 0.95
Step by Step Solution
There are 3 Steps involved in it
Step: 1

Get Instant Access to Expert-Tailored Solutions
See step-by-step solutions with expert insights and AI powered tools for academic success
Step: 2

Step: 3
Ace Your Homework with AI
Get the answers you need in no time with our AI-driven, step-by-step assistance
Get Started
Probability & Statistics For Engineers & Scientists
Authors: Ronald E. Walpole, Raymond H. Myers, Sharon L. Myers, Keying
7th Edition
9789813131279, 130415294, 9813131276, 978-0130415295