1.Predict Mobile App Popularity
mobile applications have truly revolutionized the way products and service are used. Businesses have started to realize the potential of having an app and they have begun to capitalize on the apps user-friendly nature and easy to organize features.
mobile store is a leading online market place, where businesses can host their mobile apps and users can download them. In this competitive era, the more popular the app is,the higher the returns a business can expect. With this is mind, mobile store wants to analyze what factors influence an app's popularity
Using machine learning, help them predict the popularity of an app uploaded to their markertplace. Explain how different features affect the decision.
FILES
train.csv- data used for training along with target variable
test.csv- data on which predictions are to be made
sample_submission.csv - sample format of submission
PROBLEM
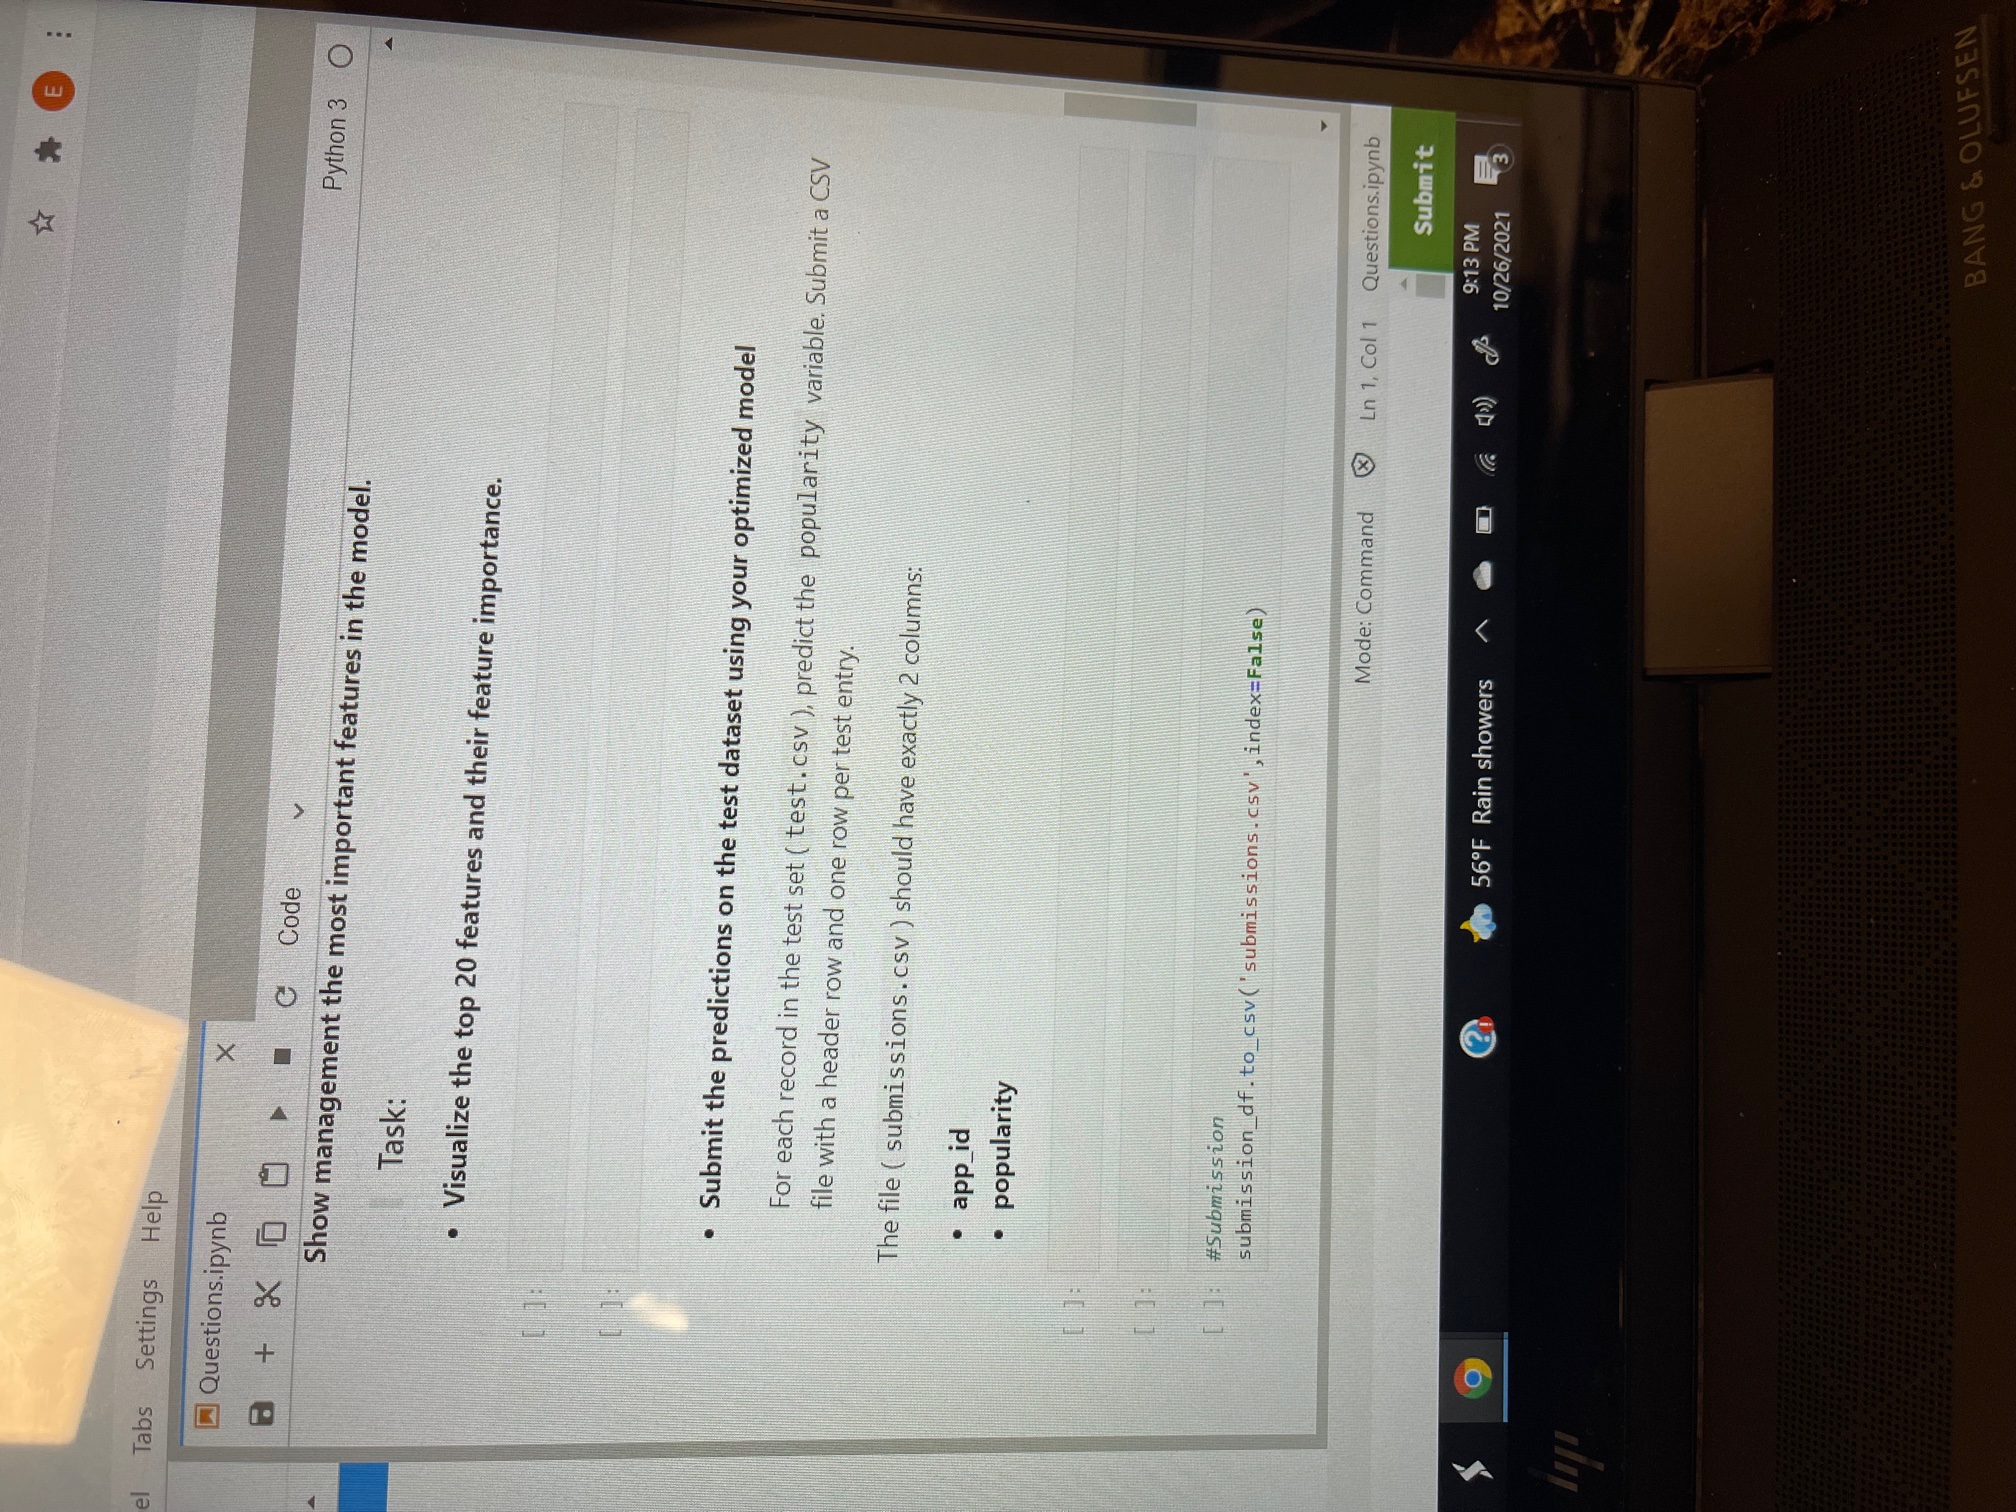
Perform an analysis of the given data to determine how different features are related to the app popularity. Build a machine learning model that can predict popularity. For each record in the test set (test.csv) predict the value of the popularity variable (High or Low).
Submit a csv file with a header row plus each of the test entries, each on its own line
the file (submissions.csv) should have exactly 2 columns:
-app-id
-popularity (High or Low)
DELIVERABLES
- well commented Jupyter notebook
-"submissions.csv"
explore the data, make visualizations, and generate new features, if required.
make appropriate plots, annotate the notebook with markdowns and explain necessary inferences
a person should be able to read the notebook and understand the steps you take as well as the reasoning behind them
The solution WOULD BE GRADED ON THE BASIS OF THE USAGE OF EFFECTIVE VISUALIZATIONS TO CONVEY THE ANALYSIS AND THE MODELING PROCESS
EVALUATION METRIC
accuracy
accuracy = number of correct predictions/total number of predictions 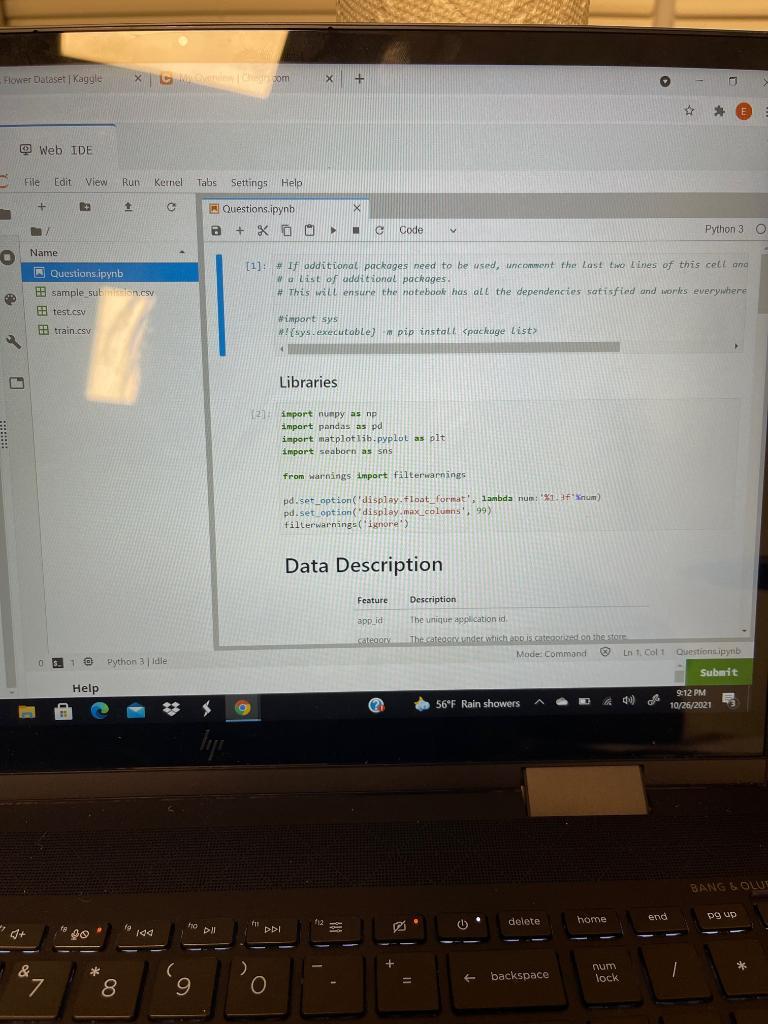
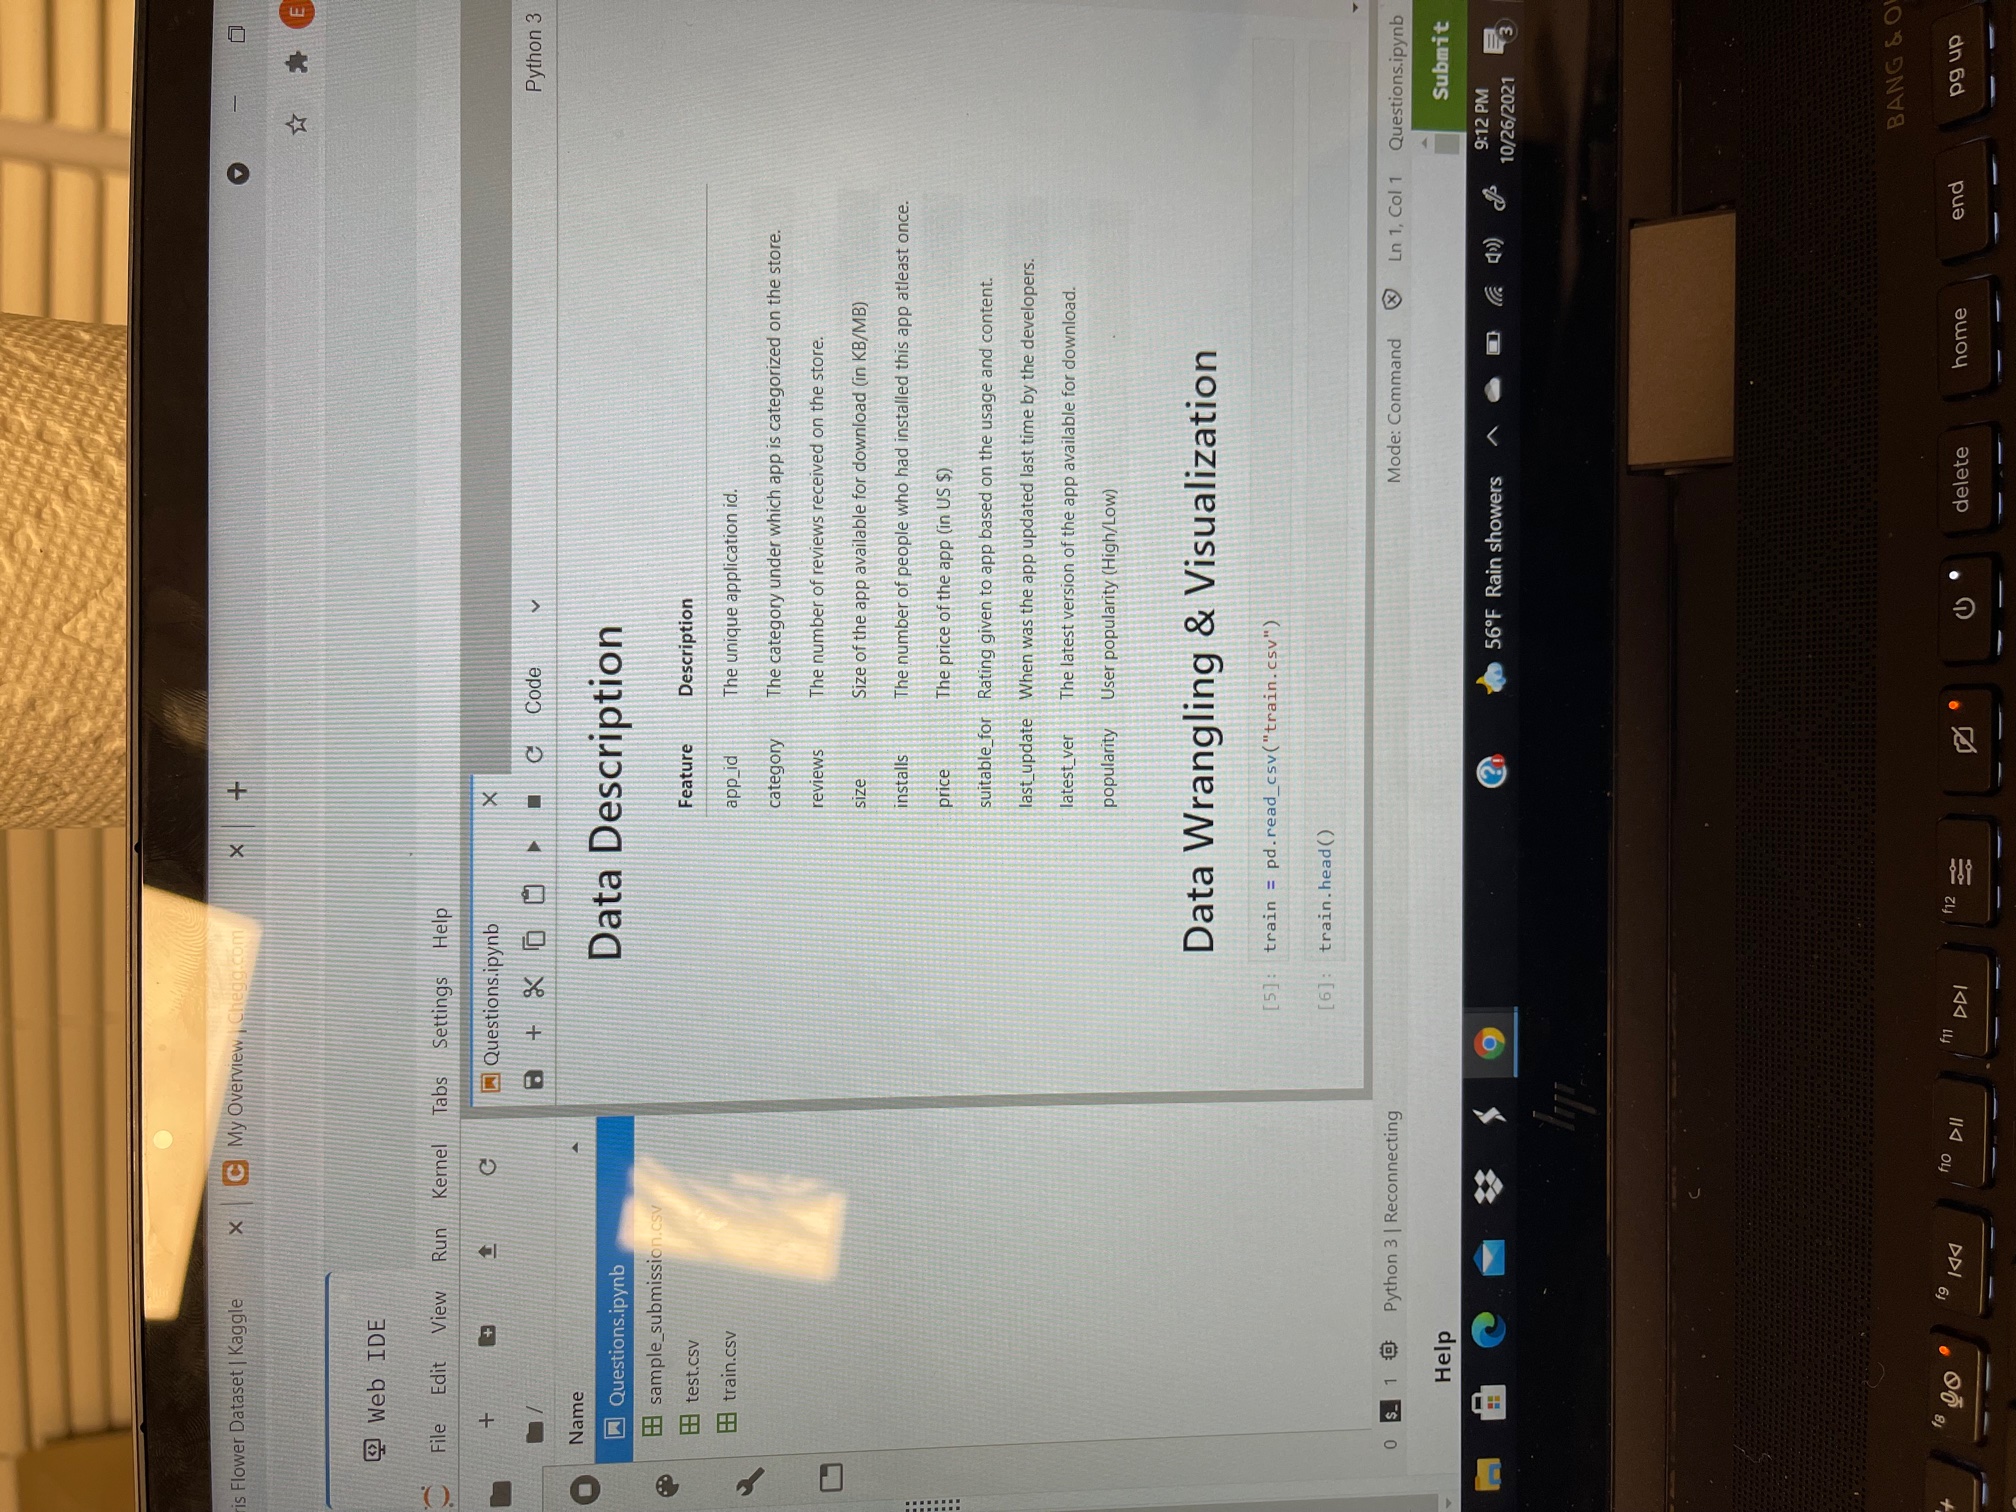
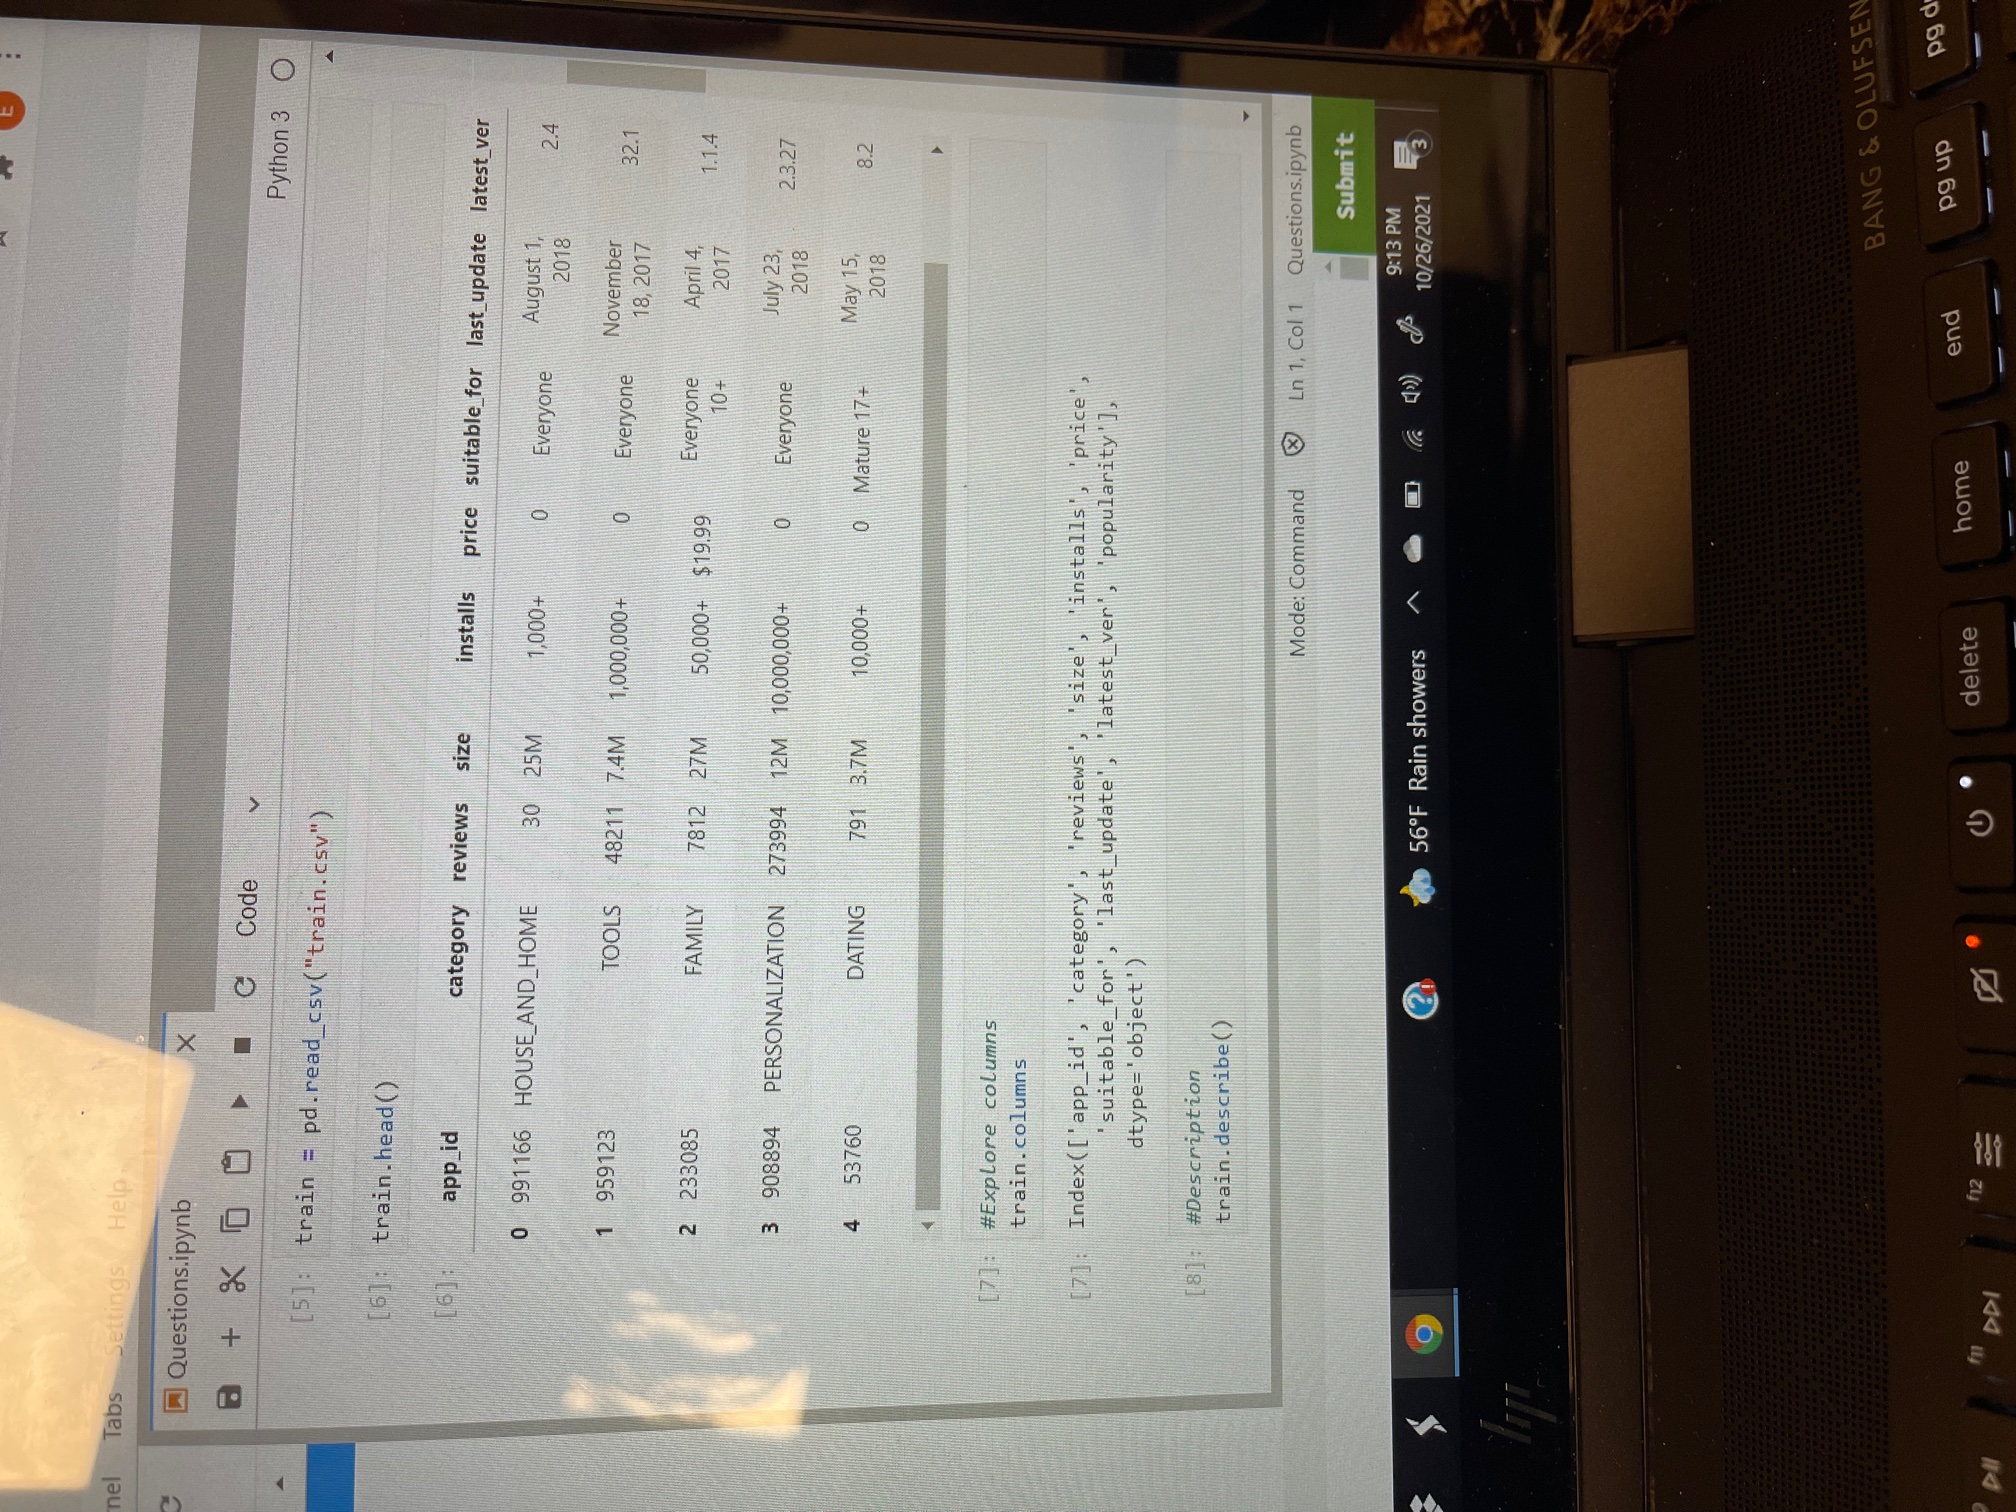
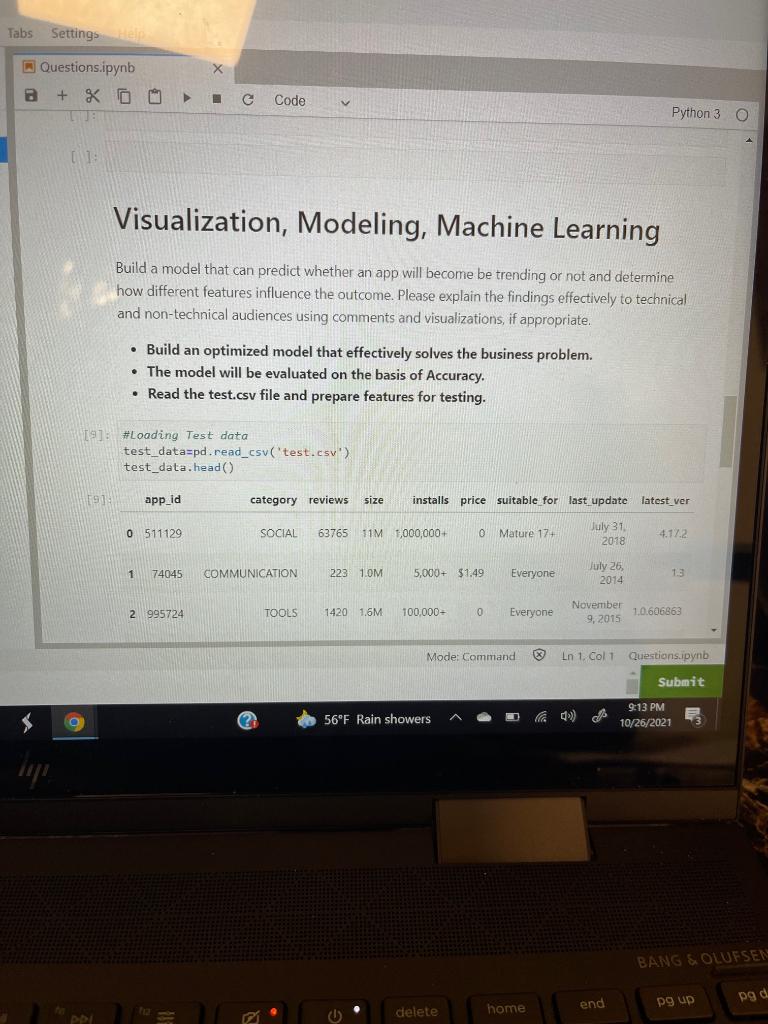
Flower Dalaset Kaggle XG com X + * E E Web IDE File Edit View Run Kernel Tabs Settings Help + + + Al Questions.ipynb a + XCO c Code Python 3 O Name Questions.ipynb E sample suban.csv [1]: If additional packages need to be used, uncomment the last two Lines of this cell and a list of additional packages. # This will ensure the notebook has all the dependencies satisfied and workes everywhere 09 test.csv FB train.csv #import sys #!/sys.executable) pip install package List> Libraries 120 import numpy as np import pandas as pd import matplotlib.pyplot as plt import seaborn as sns from warnings import filterwarnings pd.set_option('display. tlost format, lambda num:'*1. f'num) pd.set_option('display.max_columns 99) filterwarnings ('ignore') Data Description Feature Description app_id The unique application id Category Theateasty under which is categorized on the store Mode Command Lt. Colt Question tipynb 1. 0 S. 1 Python 3 Idle Submit Help 9:12 PM 10/26/2021 *** 00 9 (? 56F Rain showers lagi BANGLOW 112 home end poup delete 19 ho 100 JE Dll DDI a * I num lock backspace c. 9 7 8 o ris Flower Dataset | Kaggle C My Overview , Cheggom X + E Web IDE File Edit View Run Kernel Tabs Settings Help + + 1 C Questions.ipynb X a + XD C Code v Python 3 Name Questions.ipynb sample_submission.csv Data Description :: test.csv Feature Description HH train.csv app_id The unique application id. category The category under which app is categorized on the store. reviews The number of reviews received on the store. size Size of the app available for download (in KB/MB) installs The number of people who had installed this app atleast once. price The price of the app (in US $) suitable_for Rating given to app based on the usage and content. last_update When was the app updated last time by the developers. latest_ver The latest version of the app available for download. popularity User popularity (High/Low) Data Wrangling & Visualization [5]: train = pd.read_csv ("train.csv") [6]: train.head() 0 $_ 1 D Python 3 | Reconnecting Mode: Command Ln 1, Col 1 Questions.ipynb Help Submit 56F Rain showers 9:12 PM 10/26/2021 BANG SON 18 go f10 17 f11 f12 DII 0 DDI delete home end pg up nel Tabs Settings Help Questions.ipynb X + X Code V Python 3 [5]: train = pd.read_csv ("train.csv") [6]: train.head() [6]: app_id category reviews size installs price suitable_for_last_update latest_ver 0 991166 HOUSE_AND_HOME 30 25M 1,000+ 0 Everyone August 1, 2018 2.4 1 959123 TOOLS 48211 7.4M 1,000,000+ 0 Everyone November 18, 2017 32.1 2 238085 FAMILY 7812 27M 50,000+ $19.99 Everyone 10+ April 4, 2017 1.1.4 3 908894 PERSONALIZATION 273994 12M 10,000,000+ 0 Everyone July 23, 2018 2.3.27 4 53760 DATING 791 3.7M 10,000+ 0 Mature 17+ May 15, 2018 8.2 #Explore columns train.columns > [7]: Index(['app_id', 'category 'reviews suitable for', last update dtype='object) size installs 'price', 'latest_ver', 'popularity'), [8] #Description train.describe() Mode: Command Ln 1, Col 1 Questions.ipynb Submit 56F Rain showers 9:13 PM 10/26/2021 BANG & OLUFSEN pgd- end pg up home m 2 delete f12 pl G DDI Tabs Settings Questions.ipynb + X G Code Python 3 O Visualization, Modeling, Machine Learning Build a model that can predict whether an app will become be trending or not and determine how different features influence the outcome. Please explain the findings effectively to technical and non-technical audiences using comments and visualizations, if appropriate. Build an optimized model that effectively solves the business problem. The model will be evaluated on the basis of Accuracy. Read the test.csv file and prepare features for testing. 19] #Loading Test data test_data=pd. read_csv'test.csv) test_data.head() 191 app_id category reviews size installs price suitable for last update latest ver 0 511129 SOCIAL 63765 11M 1,000,000+ 0 Mature 17 July 31 2018 (4.172 1 74045 COMMUNICATION 223 1.0M 5,000+ $1.49 Everyone July 26, 2014 1.3 2 995724 TOOLS 1420 16M 100,000+ 0 Everyone November 9, 2015 10.606863 Mode: Command In 1. Col 1 Questions.ipynb Submit 56F Rain showers 0) 9:13 PM 10/26/2021 BANG & OLUFSEN pgd home end pg up delete PPI el Tabs Settings Help Questions.ipynb + X 5 C Code Show management the most important features in the model. Python 3 Task: Visualize the top 20 features and their feature importance. Submit the predictions on the test dataset using your optimized model For each record in the test set ( test.csv), predict the popularity variable. Submit a CSV file with a header row and one row per test entry. The file ( submissions.csv) should have exactly 2 columns: app_id popularity . [] #Submission submission_df.to_csv ('submissions.csv", index=False) Mode: Command Ln 1, Col 1 Questions.ipynb Submit 56F Rain showers 9:13 PM 10/26/2021 BANG & OLUFSEN


