

Answered step by step
Verified Expert Solution
Question
1 Approved Answer
2. (16 Points) Suppose that investors can invest into three assets that earn the following expected returns: and have the following standard deviations (on the
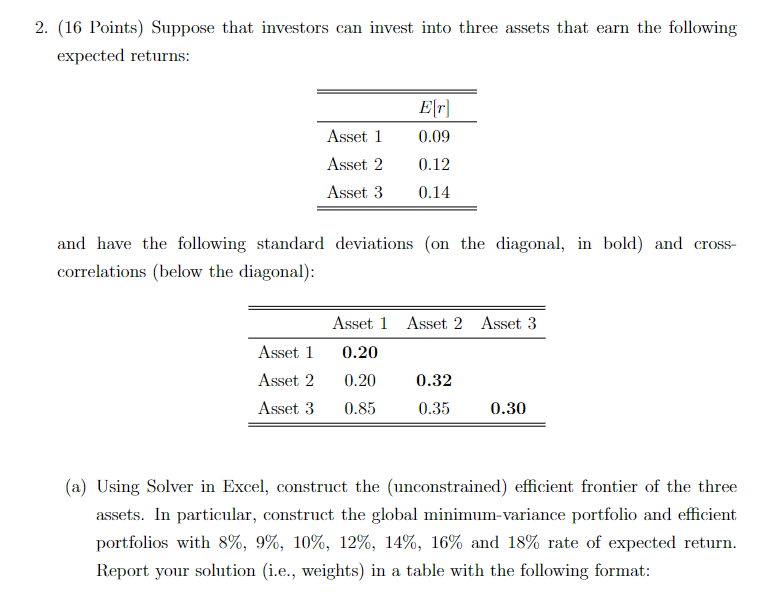
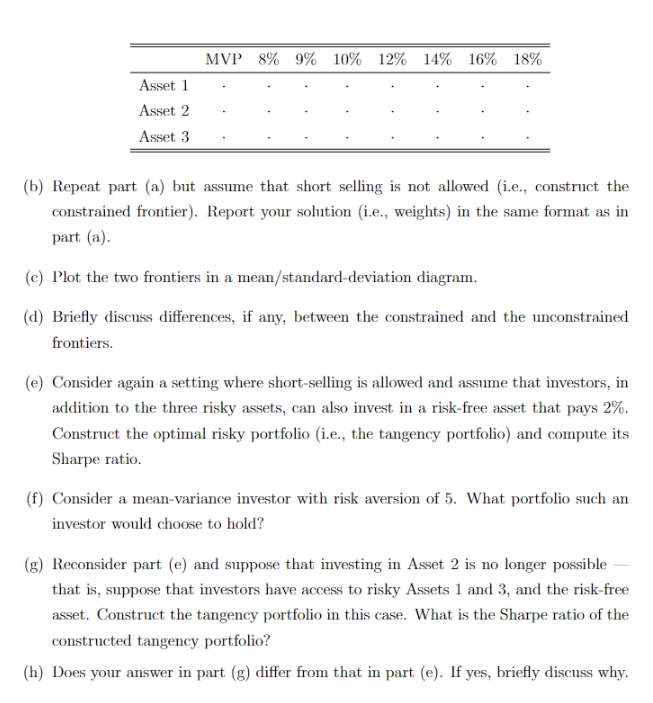 2. (16 Points) Suppose that investors can invest into three assets that earn the following expected returns: and have the following standard deviations (on the diagonal, in bold) and crosscorrelations (below the diagonal): (a) Using Solver in Excel, construct the (unconstrained) efficient frontier of the three assets. In particular, construct the global minimum-variance portfolio and efficient portfolios with 8%,9%,10%,12%,14%,16% and 18% rate of expected return. Report your solution (i.e., weights) in a table with the following format: (b) Repeat part (a) but assume that short selling is not allowed (i.e., construct the constrained frontier). Report your solution (i.e., weights) in the same format as in part (a). (c) Plot the two frontiers in a mean/standard-deviation diagram. (d) Briefly discuss differences, if any, between the constrained and the unconstrained frontiers. (e) Consider again a setting where short-selling is allowed and assume that investors, in addition to the three risky assets, can also invest in a risk-free asset that pays 2%. Construct the optimal risky portfolio (i.e., the tangency portfolio) and compute its Sharpe ratio. (f) Consider a mean-variance investor with risk aversion of 5 . What portfolio such an investor would choose to hold? (g) Reconsider part (e) and suppose that investing in Asset 2 is no longer possible that is, suppose that investors have access to risky Assets 1 and 3, and the risk-free asset. Construct the tangency portfolio in this case. What is the Sharpe ratio of the constructed tangency portfolio? (h) Does your answer in part (g) differ from that in part (e). If yes, briefly discuss why. 2. (16 Points) Suppose that investors can invest into three assets that earn the following expected returns: and have the following standard deviations (on the diagonal, in bold) and crosscorrelations (below the diagonal): (a) Using Solver in Excel, construct the (unconstrained) efficient frontier of the three assets. In particular, construct the global minimum-variance portfolio and efficient portfolios with 8%,9%,10%,12%,14%,16% and 18% rate of expected return. Report your solution (i.e., weights) in a table with the following format: (b) Repeat part (a) but assume that short selling is not allowed (i.e., construct the constrained frontier). Report your solution (i.e., weights) in the same format as in part (a). (c) Plot the two frontiers in a mean/standard-deviation diagram. (d) Briefly discuss differences, if any, between the constrained and the unconstrained frontiers. (e) Consider again a setting where short-selling is allowed and assume that investors, in addition to the three risky assets, can also invest in a risk-free asset that pays 2%. Construct the optimal risky portfolio (i.e., the tangency portfolio) and compute its Sharpe ratio. (f) Consider a mean-variance investor with risk aversion of 5 . What portfolio such an investor would choose to hold? (g) Reconsider part (e) and suppose that investing in Asset 2 is no longer possible that is, suppose that investors have access to risky Assets 1 and 3, and the risk-free asset. Construct the tangency portfolio in this case. What is the Sharpe ratio of the constructed tangency portfolio? (h) Does your answer in part (g) differ from that in part (e). If yes, briefly discuss why
 Step by Step Solution
There are 3 Steps involved in it
Step: 1

Get Instant Access to Expert-Tailored Solutions
See step-by-step solutions with expert insights and AI powered tools for academic success
Step: 2

Step: 3
Ace Your Homework with AI
Get the answers you need in no time with our AI-driven, step-by-step assistance
Get Started
Foundations Of Financial Markets And Institutions
Authors: Frank J Fabozzi, Franco G Modigliani, Frank J Jones
4th Edition
0136135315, 978-0136135319