2 /2 100% + H Exam 2 - APPLIED (2) Using the StatCrunch results obtained in Part (1), state initial/preliminary conclusions that could be made
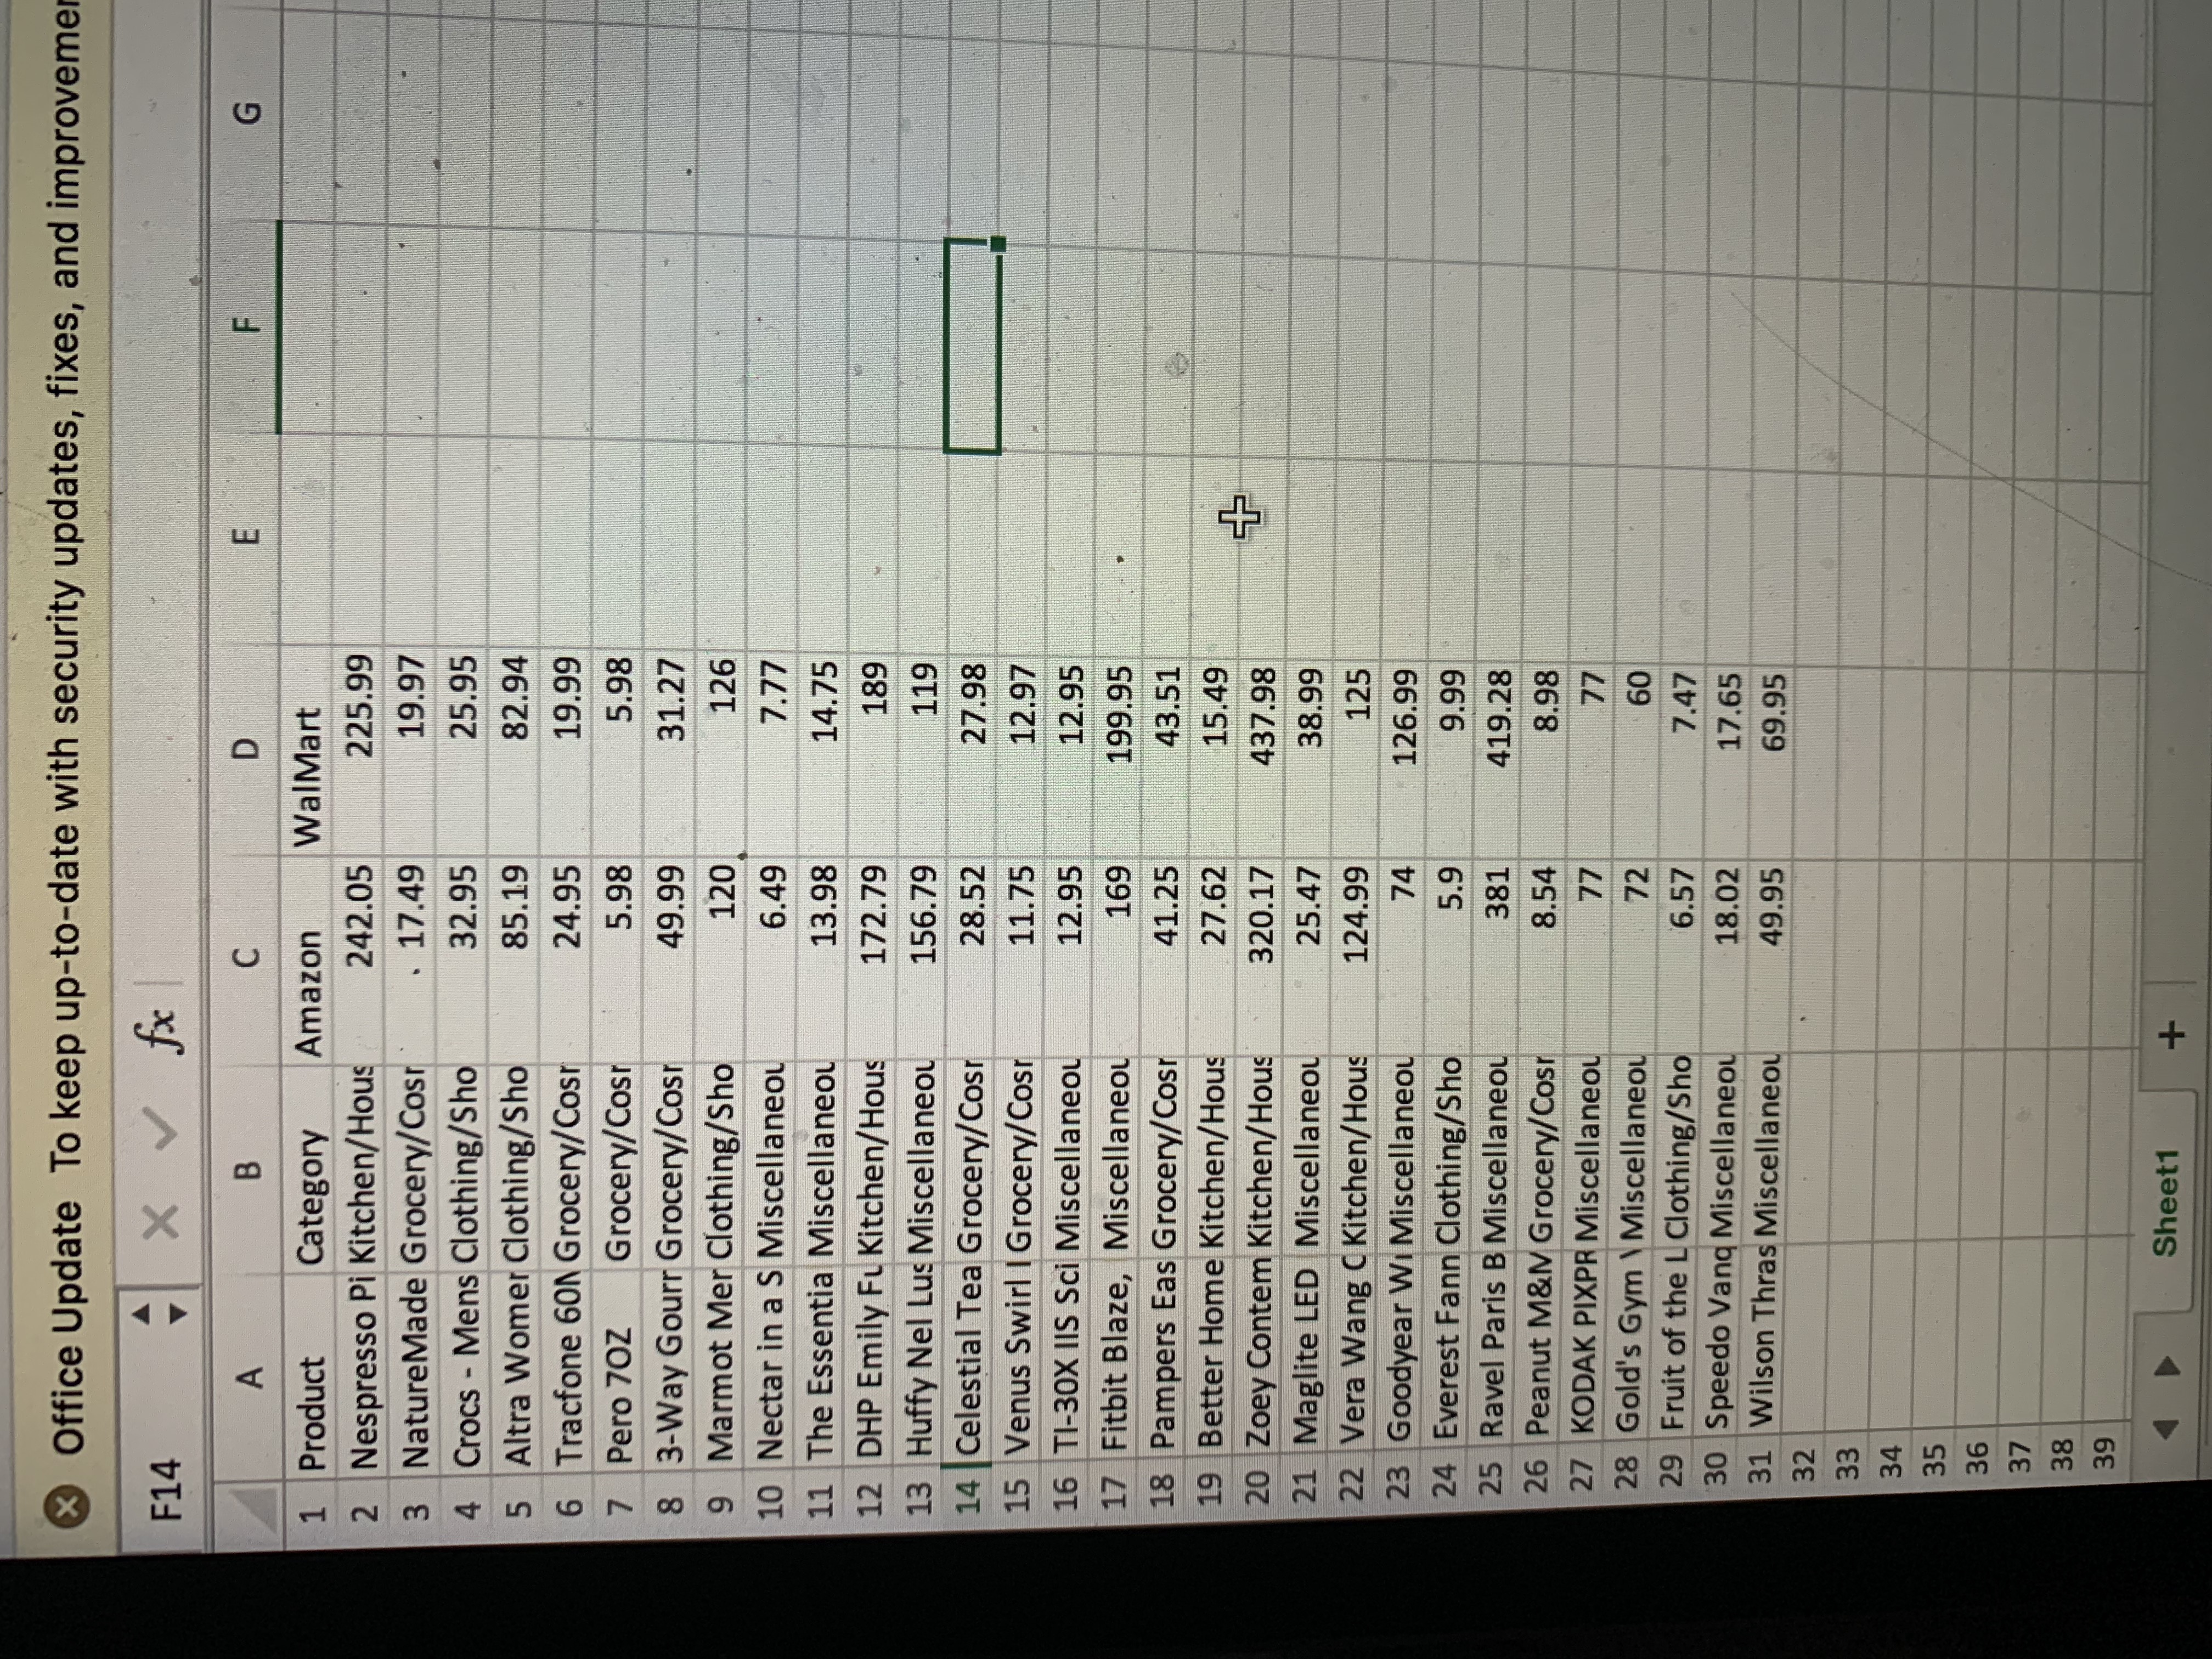
2 /2 100% + H Exam 2 - APPLIED (2) Using the StatCrunch results obtained in Part (1), state initial/preliminary conclusions that could be made in two to four complete sentences. (3) Using StatCrunch and the 'Online Seller Data' provided on Blackboard, create a statistical graph that can be used to compare the product prices for Amazon.com and Walmart.com. (i) Provide the statistical graph(s) created. (ii) In two to four complete sentences, state initial/preliminary conclusions that could be made. *Note: Any conclusions made up to this point have been 'initial' and do not suggest statistical significance yet, as no formal statistical testing or other inferential procedure such as confidence interval estimation has been performed. You will need to move beyond summary statistics and beyond visualizations for Part (4) below! That's a hint! @ (4) One research question that could be posed using the available data: "Do product prices differ significantly between Amazon.com and Walmart.com and, if so, by how much?" Determine a method that would be appropriate for answering this research question. Using StatCrunch and the available data, perform the statistical procedure deemed appropriate. Hint: You will need to go beyond the exploratory data analysis (i.e., summary statistics and visualizations) in Questions 1-3 above. (i) What method did you use to answer the research question e.g., One-Sample t-Test for Means? (ii) Why did you select this particular method to answer the research question? (iii) In one to two complete sentences, summarize and interpret the relevant findings of your analysis in the context of the research question i.e., what do the findings suggest about the impact of online retailer on product prices? (iv) Consider and, then, suggest how you would approach data collection in the future if you were interested in comparing Amazon.com and Walmart.com product prices for one particular market sector/category within online sales (e.g., Grocery/Cosmetic) during fall 2020. DD F6 F7 F8 FO F 10 F11 F5 & 71635552000000&X-... 1 /2 100% + Late submissions will not be accepted. - Applied Prompt & Questions - Dataset Description: Actual November 2017 selling costs for products (accessed publicly from Amazon.com and Walmart.com) Variables: Product - Description of the product being sold Category - Broad category for the product (Kitchen/Housewares, Grocery/Cosmetic, Clothing/Shoes, or Miscellaneous) Amazon - November 2017 product price (US $) on Amazon.com WalMart - November 2017 product price (US $) on Walmart.com *Note: The 'Online Seller Data' is provided on Blackboard. Open this data into StatCrunch for the subsequent analyses. This can be done by highlighting the data in the Excel file, copying the highlighted data (CTRL+C for Windows or Command+C for Macs), and pasting the copied data into an open StatCrunch window (CTRL+V for Windows or Command+V for Macs). (1) Using StatCrunch and the 'Online Seller Data' provided on Blackboard, find and report the following summary statistics, representing both measures of center (e.g., mean and median) and measures of variation/spread (e.g., standard deviation and range): (i) The mean and median for Amazon.com product prices. (ii) The mean and median for Walmart.com product prices. (iii) The standard deviation and range for Amazon.com product prices. (iv) The standard deviation and range for Walmart.com product prices. 1 | Page S. Robinson Exam 2 - APPLIED DII DD A F5 FO E7 F9 F10 F13 & 5 6 9
Step by Step Solution
There are 3 Steps involved in it
Step: 1
Get Instant Access to Expert-Tailored Solutions
See step-by-step solutions with expert insights and AI powered tools for academic success
Step: 2
Step: 3
Ace Your Homework with AI
Get the answers you need in no time with our AI-driven, step-by-step assistance