Question
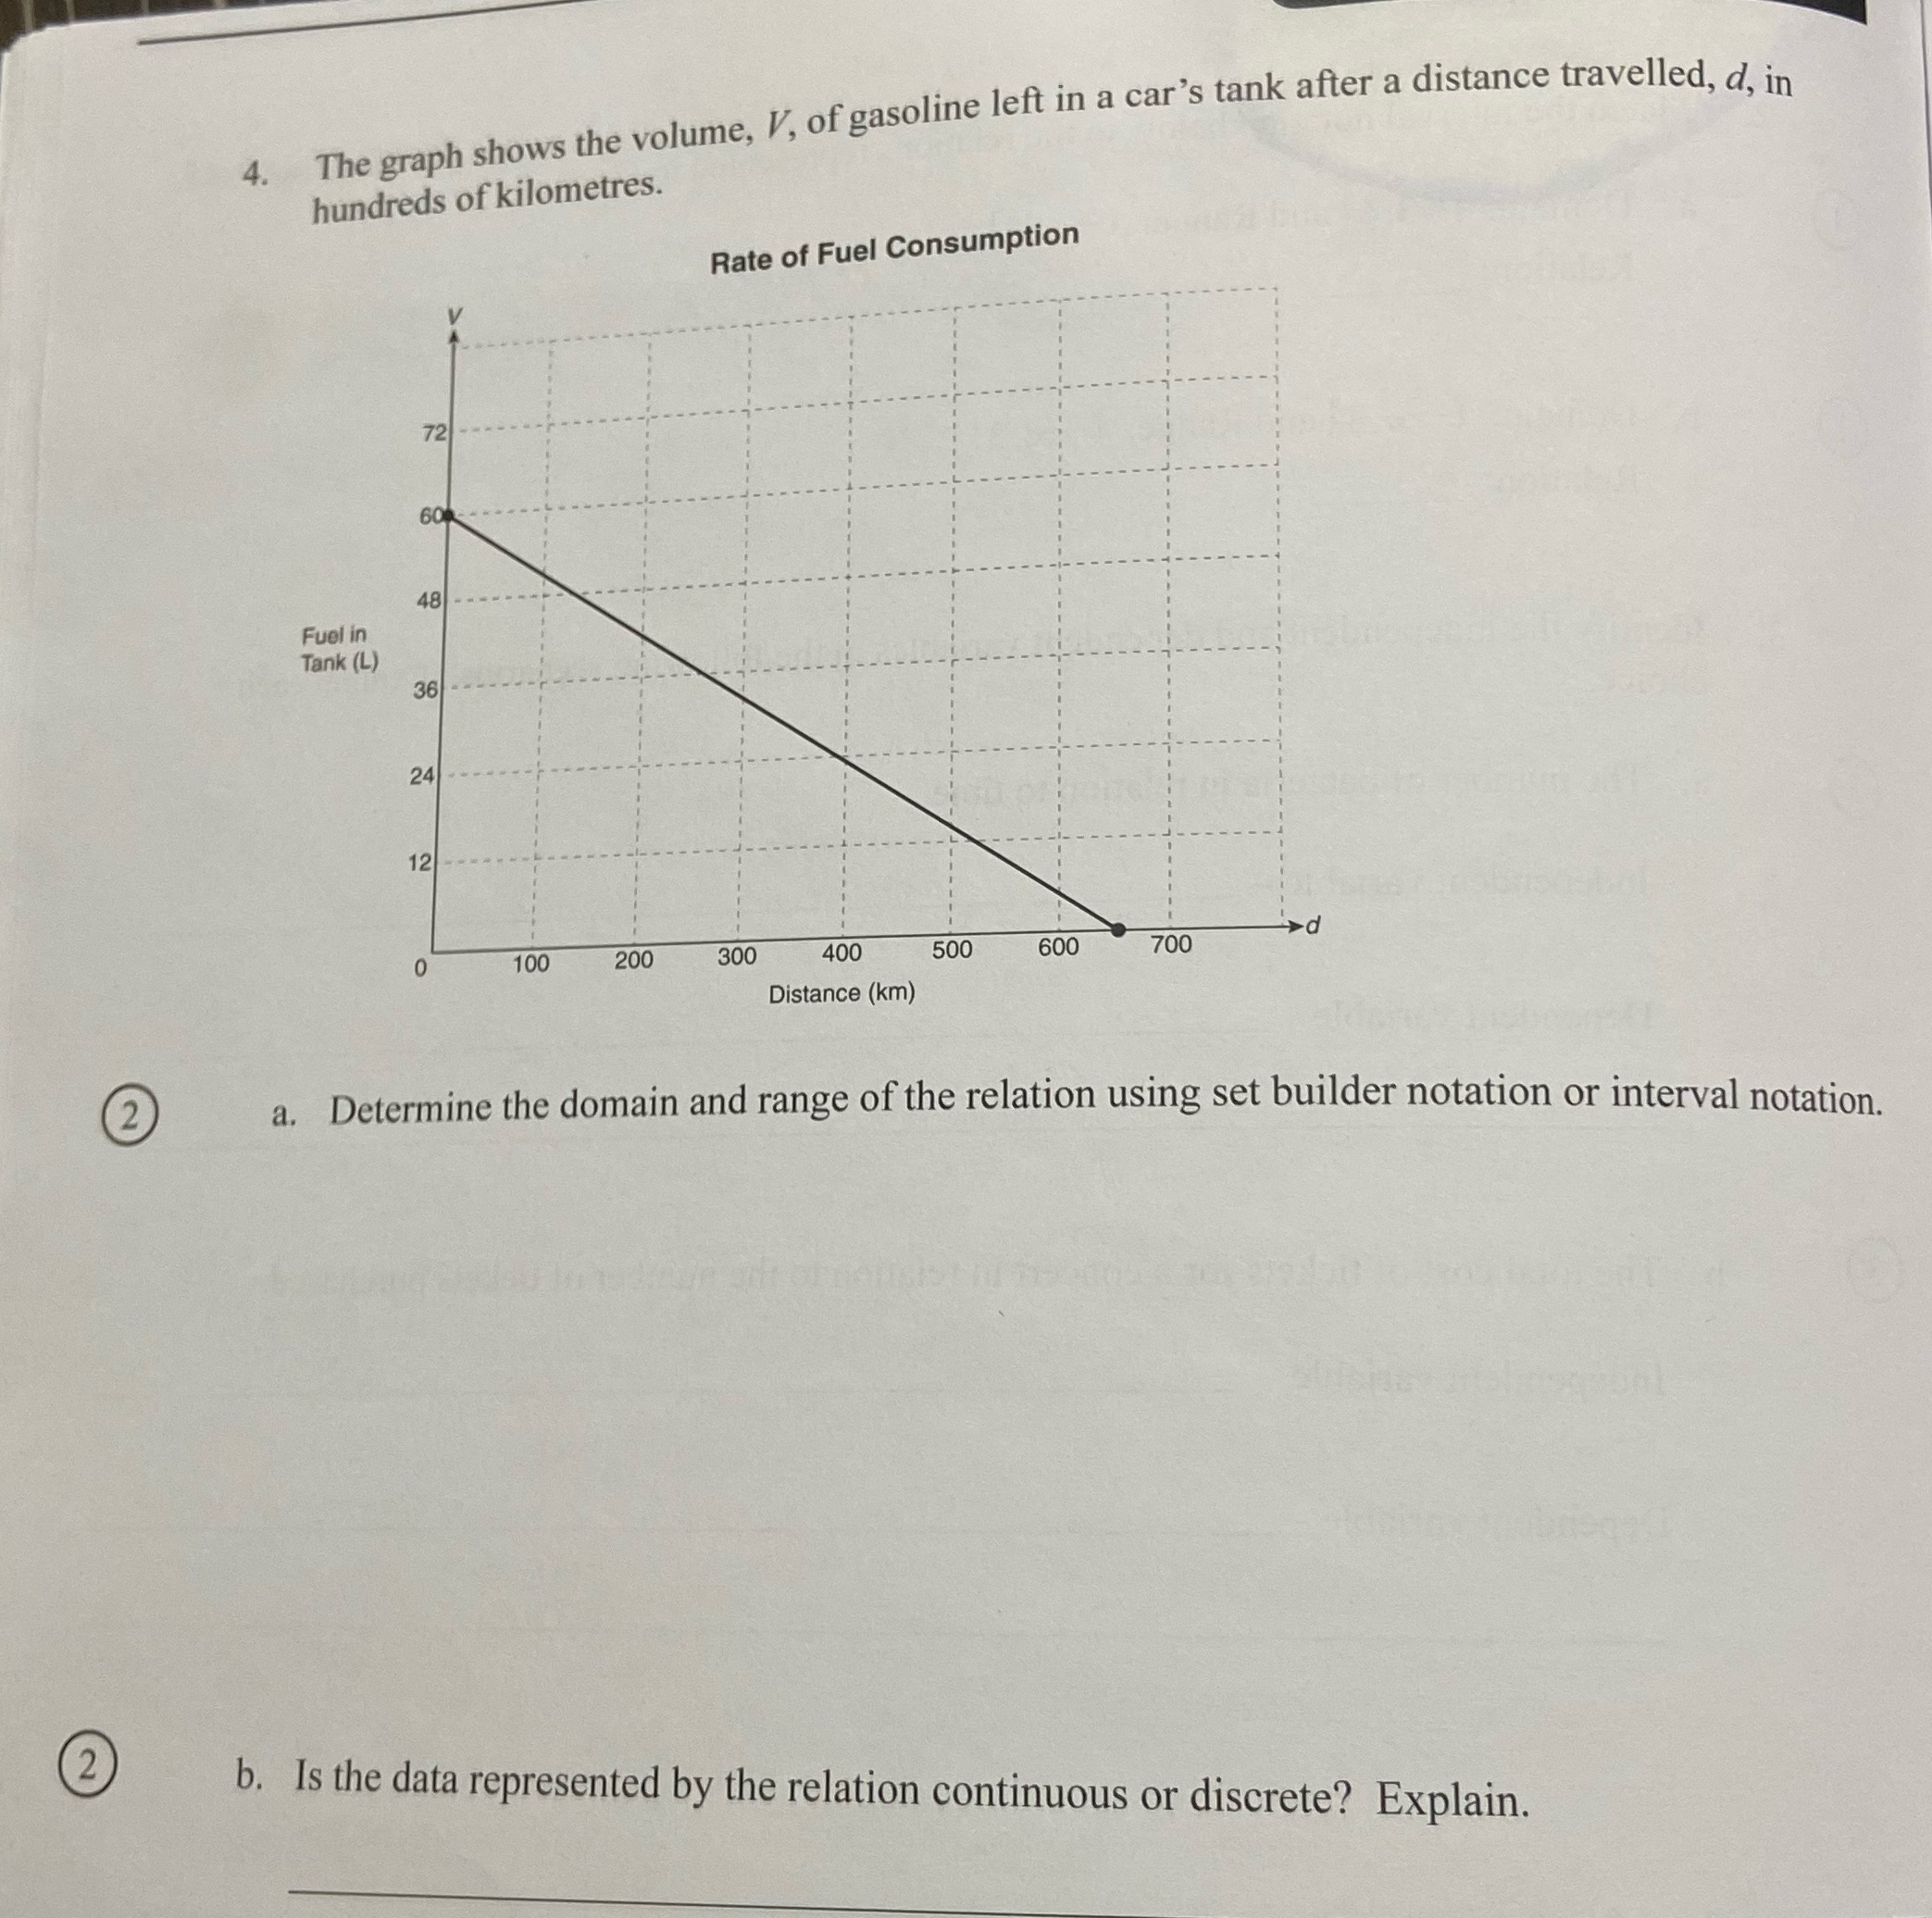
2 2 4. The graph shows the volume, V, of gasoline left in a car's tank after a distance travelled, d, in hundreds of

2 2 4. The graph shows the volume, V, of gasoline left in a car's tank after a distance travelled, d, in hundreds of kilometres. Fuel in Tank (L) 72 60 48 36 24 12 0 100 Rate of Fuel Consumption 200 300 400 Distance (km) a. Determine the domain and range of the relation using set builder notation or interval notation. 500 600 700 b. Is the data represented by the relation continuous or discrete? Explain.
Step by Step Solution
There are 3 Steps involved in it
Step: 1

Get Instant Access to Expert-Tailored Solutions
See step-by-step solutions with expert insights and AI powered tools for academic success
Step: 2

Step: 3

Ace Your Homework with AI
Get the answers you need in no time with our AI-driven, step-by-step assistance
Get StartedRecommended Textbook for
Engineering Economics Analysis
Authors: Ted G. Feller
9th Edition
9780195168075
Students also viewed these Mathematics questions
Question
Answered: 1 week ago
Question
Answered: 1 week ago
Question
Answered: 1 week ago
Question
Answered: 1 week ago
Question
Answered: 1 week ago
Question
Answered: 1 week ago
Question
Answered: 1 week ago
Question
Answered: 1 week ago
Question
Answered: 1 week ago
Question
Answered: 1 week ago
Question
Answered: 1 week ago
Question
Answered: 1 week ago
Question
Answered: 1 week ago
Question
Answered: 1 week ago
Question
Answered: 1 week ago
Question
Answered: 1 week ago
Question
Answered: 1 week ago
Question
Answered: 1 week ago
Question
Answered: 1 week ago
Question
Answered: 1 week ago
Question
Answered: 1 week ago
Question
Answered: 1 week ago
View Answer in SolutionInn App


