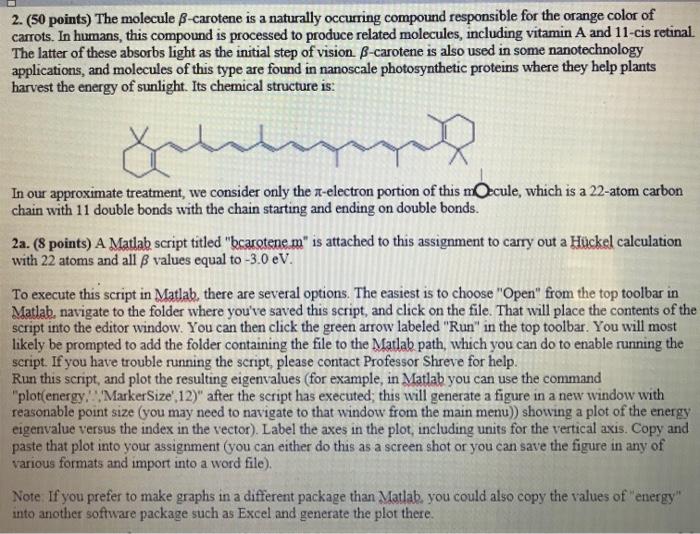
2. (50 points) The molecule -carotene is a naturally occurring compound responsible for the orange color of carrots. In humans, this compound is processed to produce related molecules, including vitamin A and 11-cis retinal. The latter of these absorbs light as the initial step of vision -carotene is also used in some nanotechnology applications, and molecules of this type are found in nanoscale photosynthetic proteins where they help plants harvest the energy of sunlight. Its chemical structure is: In our approximate treatment, we consider only the -electron portion of this mOecule, which is a 22-atom carbon chain with 11 double bonds with the chain starting and ending on double bonds. 2a. ( 8 points) A Matlab script titled "bcarotene m " is attached to this assignment to carry out a Huckel calculation with 22 atoms and all values equal to 3.0eV. To execute this script in Matlab, there are several options. The easiest is to choose "Open" from the top toolbar in Matlab, navigate to the folder where you've saved this script, and click on the file. That will place the contents of the script into the editor window. You can then click the green arrow labeled "Run" in the top toolbar. You will most likely be prompted to add the folder containing the file to the Matlab path, which you can do to enable running the script. If you have trouble running the script, please contact Professor Shreve for help. Run this script, and plot the resulting eigenvalues (for example, in Matlab you can use the command "plot(energy...'MarkerSize',12)" after the script has executed; this will generate a figure in a new window with reasonable point size (you may need to navigate to that window from the main menu)) showing a plot of the energy eigenvalue versus the index in the vector). Label the axes in the plot, including units for the vertical axis. Copy and paste that plot into your assignment (you can either do this as a screen shot or you can save the figure in any of various formats and import into a word file). Note. If you prefer to make graphs in a different package than Matlab, you could also copy the values of "energy" into another soffware package such as Excel and generate the plot there. 2. (50 points) The molecule -carotene is a naturally occurring compound responsible for the orange color of carrots. In humans, this compound is processed to produce related molecules, including vitamin A and 11-cis retinal. The latter of these absorbs light as the initial step of vision -carotene is also used in some nanotechnology applications, and molecules of this type are found in nanoscale photosynthetic proteins where they help plants harvest the energy of sunlight. Its chemical structure is: In our approximate treatment, we consider only the -electron portion of this mOecule, which is a 22-atom carbon chain with 11 double bonds with the chain starting and ending on double bonds. 2a. ( 8 points) A Matlab script titled "bcarotene m " is attached to this assignment to carry out a Huckel calculation with 22 atoms and all values equal to 3.0eV. To execute this script in Matlab, there are several options. The easiest is to choose "Open" from the top toolbar in Matlab, navigate to the folder where you've saved this script, and click on the file. That will place the contents of the script into the editor window. You can then click the green arrow labeled "Run" in the top toolbar. You will most likely be prompted to add the folder containing the file to the Matlab path, which you can do to enable running the script. If you have trouble running the script, please contact Professor Shreve for help. Run this script, and plot the resulting eigenvalues (for example, in Matlab you can use the command "plot(energy...'MarkerSize',12)" after the script has executed; this will generate a figure in a new window with reasonable point size (you may need to navigate to that window from the main menu)) showing a plot of the energy eigenvalue versus the index in the vector). Label the axes in the plot, including units for the vertical axis. Copy and paste that plot into your assignment (you can either do this as a screen shot or you can save the figure in any of various formats and import into a word file). Note. If you prefer to make graphs in a different package than Matlab, you could also copy the values of "energy" into another soffware package such as Excel and generate the plot there


