Answered step by step
Verified Expert Solution
Question
1 Approved Answer
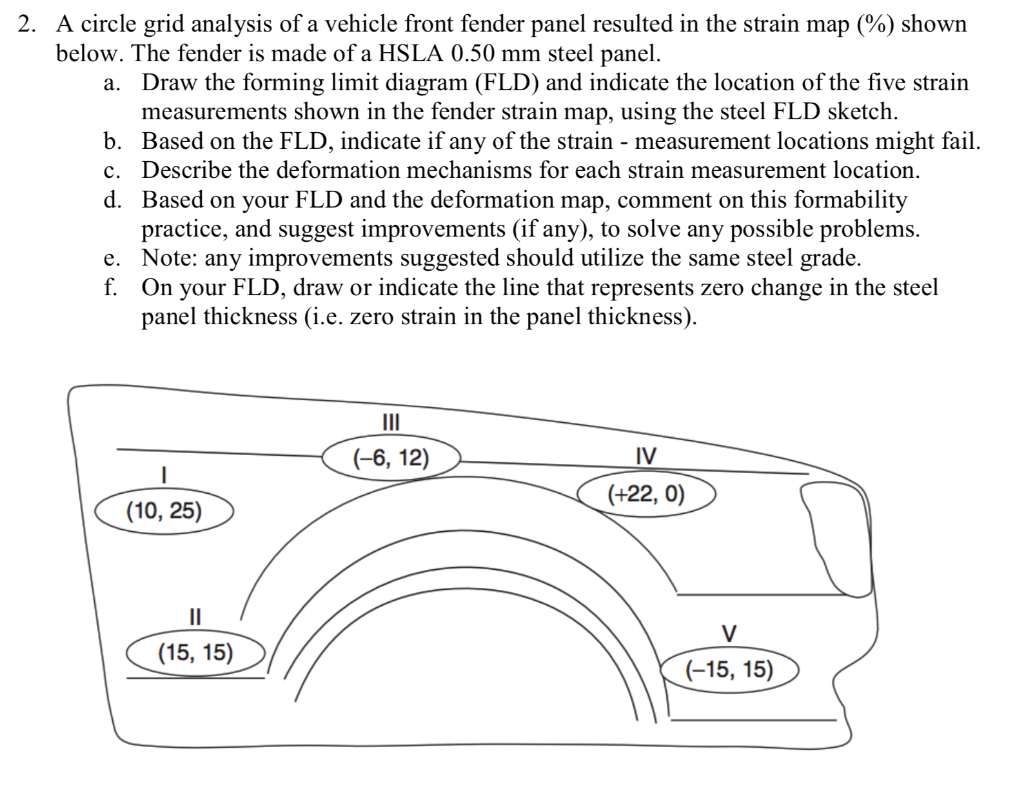
2. A circle grid analysis of a vehicle front fender panel resulted in the strain map (%) shown below. The fender is made of

2. A circle grid analysis of a vehicle front fender panel resulted in the strain map (%) shown below. The fender is made of a HSLA 0.50 mm steel panel. a. Draw the forming limit diagram (FLD) and indicate the location of the five strain measurements shown in the fender strain map, using the steel FLD sketch. b. Based on the FLD, indicate if any of the strain - measurement locations might fail. c. Describe the deformation mechanisms for each strain measurement location. d. Based on your FLD and the deformation map, comment on this formability practice, and suggest improvements (if any), to solve any possible problems. e. Note: any improvements suggested should utilize the same steel grade. f. On your FLD, draw or indicate the line that represents zero change in the steel panel thickness (i.e. zero strain in the panel thickness). II (-6, 12) IV (+22, 0) (10, 25) II V (15, 15) (-15, 15)
Step by Step Solution
★★★★★
3.33 Rating (159 Votes )
There are 3 Steps involved in it
Step: 1
To address the question regarding the circle grid analysis of a vehicle front fender panel and the f...
Get Instant Access to Expert-Tailored Solutions
See step-by-step solutions with expert insights and AI powered tools for academic success
Step: 2

Step: 3

Ace Your Homework with AI
Get the answers you need in no time with our AI-driven, step-by-step assistance
Get Started


