Answered step by step
Verified Expert Solution
Question
1 Approved Answer
2. A portfolio is composed of two stocks. The proportion of each stock, their expected values, and standard deviations are listed next. Stock 1

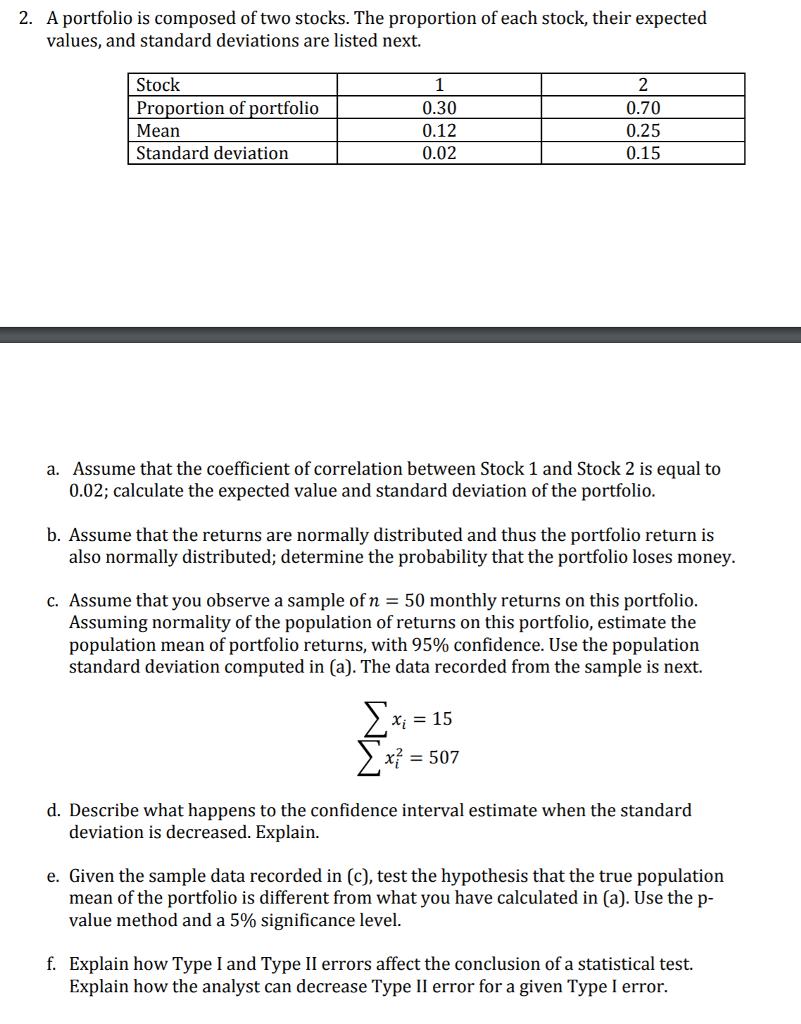
2. A portfolio is composed of two stocks. The proportion of each stock, their expected values, and standard deviations are listed next. Stock 1 2 Proportion of portfolio 0.30 0.70 Mean 0.12 0.25 Standard deviation 0.02 0.15 a. Assume that the coefficient of correlation between Stock 1 and Stock 2 is equal to 0.02; calculate the expected value and standard deviation of the portfolio. b. Assume that the returns are normally distributed and thus the portfolio return is also normally distributed; determine the probability that the portfolio loses money. c. Assume that you observe a sample of n = 50 monthly returns on this portfolio. Assuming normality of the population of returns on this portfolio, estimate the population mean of portfolio returns, with 95% confidence. Use the population standard deviation computed in (a). The data recorded from the sample is next. x = 15 x = 507 d. Describe what happens to the confidence interval estimate when the standard deviation is decreased. Explain. e. Given the sample data recorded in (c), test the hypothesis that the true population mean of the portfolio is different from what you have calculated in (a). Use the p- value method and a 5% significance level. f. Explain how Type I and Type II errors affect the conclusion of a statistical test. Explain how the analyst can decrease Type II error for a given Type I error.
Step by Step Solution
There are 3 Steps involved in it
Step: 1

Get Instant Access to Expert-Tailored Solutions
See step-by-step solutions with expert insights and AI powered tools for academic success
Step: 2

Step: 3

Ace Your Homework with AI
Get the answers you need in no time with our AI-driven, step-by-step assistance
Get Started


