Answered step by step
Verified Expert Solution
Link Copied!

Question

1 Approved Answer

2. A random sample of voters in Nashville, Tennessee, is classified by age group, as shown by the following data. a. Calculate the mean of
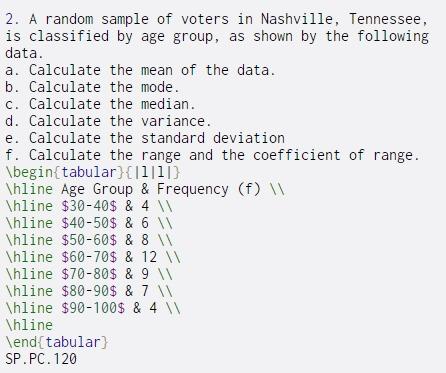
image text in transcribed

2. A random sample of voters in Nashville, Tennessee, is classified by age group, as shown by the following data. a. Calculate the mean of the data. b. Calculate the mode. c. Calculate the median. d. Calculate the variance. e. Calculate the standard deviation f. Calculate the range and the coefficient of range. \begin{tabular}{[111]] \hline Age Group & Frequency (f) W \hline $30-40$ & 4 Thline $40-50$ & 6 W \hline $50-60$ & 8 Thline $60-70$ & 12 \hline $70-80$ & 9W \hline $80-90$ & 7 \hline $90-100$ & 4 W \hline \end{tabular SP.PC. 120

Step by Step Solution

There are 3 Steps involved in it

Step: 1

blur-text-image

Get Instant Access to Expert-Tailored Solutions

See step-by-step solutions with expert insights and AI powered tools for academic success

Step: 2

blur-text-image

Step: 3

blur-text-image

Ace Your Homework with AI

Get the answers you need in no time with our AI-driven, step-by-step assistance

Get Started

Recommended Textbook for

SQL Antipatterns Avoiding The Pitfalls Of Database Programming

Authors: Bill Karwin

1st Edition

1680508989, 978-1680508987

More Books

Students also viewed these Databases questions