

Answered step by step
Verified Expert Solution
Question
1 Approved Answer
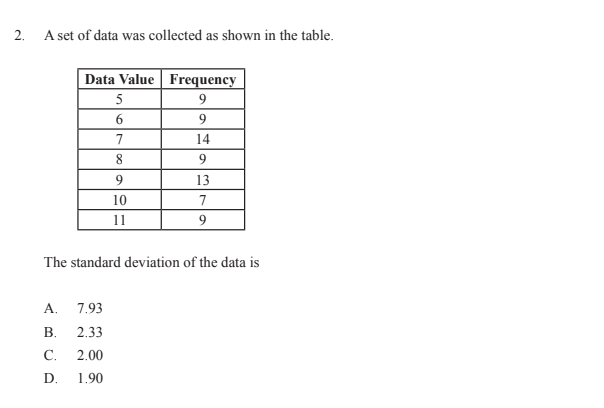
2. A set of data was collected as shown in the table. Data Value Frequency 5 9 6 9 7 14 9 13 10 7

Step by Step Solution
There are 3 Steps involved in it
Step: 1

Get Instant Access to Expert-Tailored Solutions
See step-by-step solutions with expert insights and AI powered tools for academic success
Step: 2

Step: 3
Ace Your Homework with AI
Get the answers you need in no time with our AI-driven, step-by-step assistance
Get Started
Algebra And Trigonometry (Subscription)
Authors: Michael Sullivan, Michael Sullivan III
11th Edition
0135227712, 9780135227718