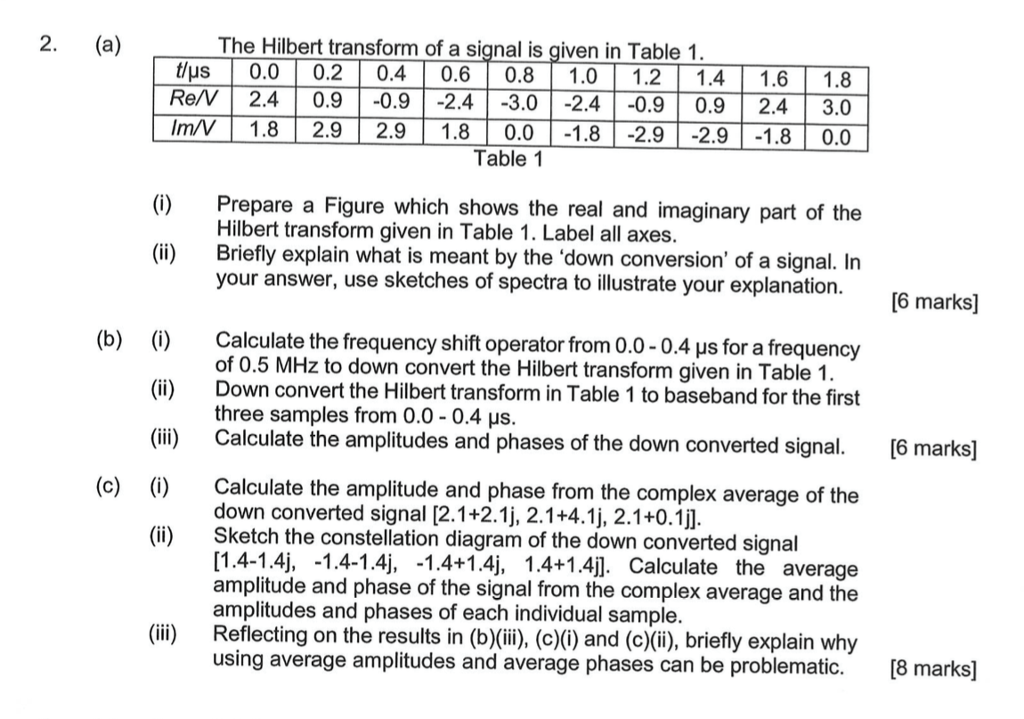
2. (a) The Hilbert transform of a signal is given in Table 1 ReN 24 0.9 0.9 -2.4 3.0 -2.4 -0.9 0.9 24 3.0 Im/V 1.82.9 2.9 1.8 0.0 -1.8 -2.9 -2.9 -1.8 0.0 Table 1 (i) Prepare a Figure which shows the real and imaginary part of the (ii) Briefly explain what is meant by the 'down conversion' of a signal. In Hilbert transform given in Table 1. Label all axes. your answer, use sketches of spectra to illustrate your explanation. [6 marks] (b) (i) Calculate the frequency shift operator from 0.0-0.4 us for a frequency of 0.5 MHz to down convert the Hilbert transform given in Table 1 Down convert the Hilbert transform in Table 1 to baseband for the first three samples from 0.0-0.4 s (ii) (i) Calculate the amplitudes and phases of the down converted signal 6 marks] (i)Calculate the amplitude and phase from the complex average of the (ii) (c) down converted signal [2.1+2.1j, 2.1+4.1j, 2.1+0.1 Sketch the constellation diagram of the down converted signal [1.4-1.4j, -1.4-1.4j, -1.4+1.4j, 1.4+1.4j Calculate the average amplitude and phase of the signal from the complex average and the amplitudes and phases of each individual sample. (ii) Reflecting on the results in (b)(ii), (c)(i) and (c)(i), briefly explain why using average amplitudes and average phases can be problematic. 2. (a) The Hilbert transform of a signal is given in Table 1 ReN 24 0.9 0.9 -2.4 3.0 -2.4 -0.9 0.9 24 3.0 Im/V 1.82.9 2.9 1.8 0.0 -1.8 -2.9 -2.9 -1.8 0.0 Table 1 (i) Prepare a Figure which shows the real and imaginary part of the (ii) Briefly explain what is meant by the 'down conversion' of a signal. In Hilbert transform given in Table 1. Label all axes. your answer, use sketches of spectra to illustrate your explanation. [6 marks] (b) (i) Calculate the frequency shift operator from 0.0-0.4 us for a frequency of 0.5 MHz to down convert the Hilbert transform given in Table 1 Down convert the Hilbert transform in Table 1 to baseband for the first three samples from 0.0-0.4 s (ii) (i) Calculate the amplitudes and phases of the down converted signal 6 marks] (i)Calculate the amplitude and phase from the complex average of the (ii) (c) down converted signal [2.1+2.1j, 2.1+4.1j, 2.1+0.1 Sketch the constellation diagram of the down converted signal [1.4-1.4j, -1.4-1.4j, -1.4+1.4j, 1.4+1.4j Calculate the average amplitude and phase of the signal from the complex average and the amplitudes and phases of each individual sample. (ii) Reflecting on the results in (b)(ii), (c)(i) and (c)(i), briefly explain why using average amplitudes and average phases can be problematic