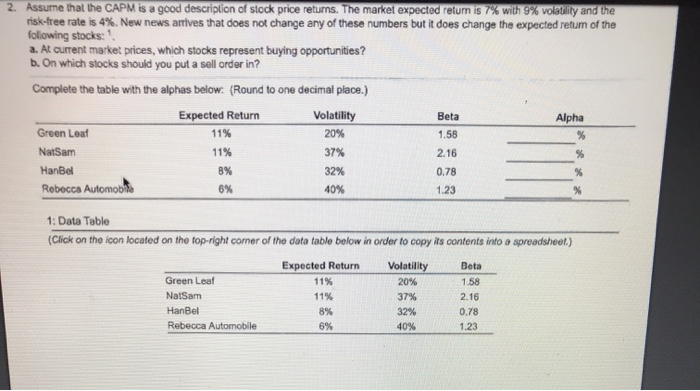
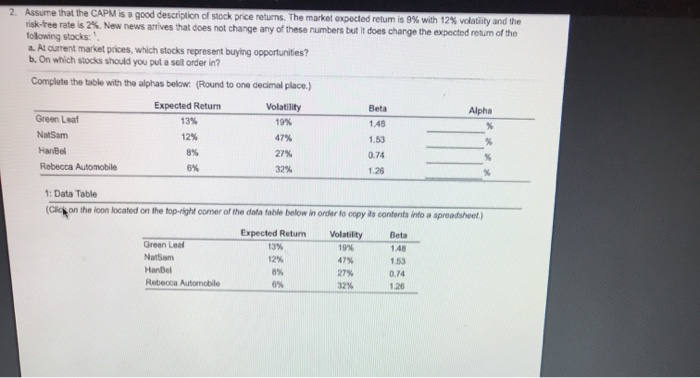
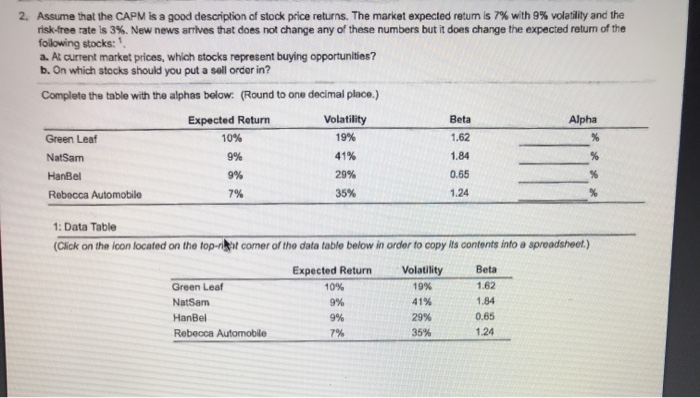
2. Assume that the CAPM is a good description of stock price returns. The market expected retum is 7% with 9% volatility and the risk-free rate is 4%. New news artives that does not change any of these numbers but it does change the expected return of the following stocks: a. At current market prices, which stocks represent buying opportunities? b. On which stocks should you put a sell order in? Complete the table with the alphas below. (Round to one decimal place.) Alpha Green Leat Natsam HanBol Rebecca Automobile Expected Return 11% 11% 8% Volatility 20% 37% 32% 40% Beta 1.58 2.16 0.78 1.23 1: Data Table (Click on the icon located on the fop-right corner of the data table below in order to copy its contents into a spreadsheet) Expected Return Beta 11% Volatility 20% 37% 3294 11% Green Leaf Natsam HanBel Rebecca Automobile 2.16 1.23 2. Assume that the CAPM is a good description of stock price returns. The market expected retum is 9% with 12% volatility and the risk-free rate is 2%. New news arrives that does not change any of these numbers but it does change the expected return of the following stocks a. At current market prices, which stocks represent buying opportunities? b. On which stocks should you put a sell order in? Complete the table with the alphas below. (Round to one decimal place.) Beta Alpha Green Laat Natsam Hansel Expected Return 13% 12% 8% 6% Volatility 19% 47% 27% Rebecca Automobile 3246 1: Data Table (Click on the loon located on the top-right comer of the datatable below in order to copy is contents into a spreadsheet.) Expected Retur 13% Volatility Green La Naam Hanbel Rebecca Automobile 153 0.74 1-26 2. Assume that the CAPM is a good description of stock price returns. The market expected retum is 7% with 9% volatility and the risk-free rate is 3%. New news artives that does not change any of these numbers but it does change the expected return of the following stocks: a. At current market prices, which stocks represent buying opportunities? b. On which stocks should you put a sell order in? Complete the table with the alphas below. (Round to one decimal place.) Alpha Expected Return 10% 9% Green Leaf NatSam HanBel Rebecca Automobile Volatility 19% 41% 29% 35% Beta 1.62 1.84 0.65 1.24 9% 7% 1: Data Table (Click on the icon located on the top- rat comer of the data table below in order to copy its contents into a spreadsheet.) Beta 1.62 Green Leaf Natsam HanBel Rebecca Automobile Expected Return 10% 9% 9% 7% Volatility 19% 41% 29% 35% 1.84 0.65 1.24


