Question
2. Below is a list of Gini Indices for the United States. To the right, create two time-series graphs on the same set of

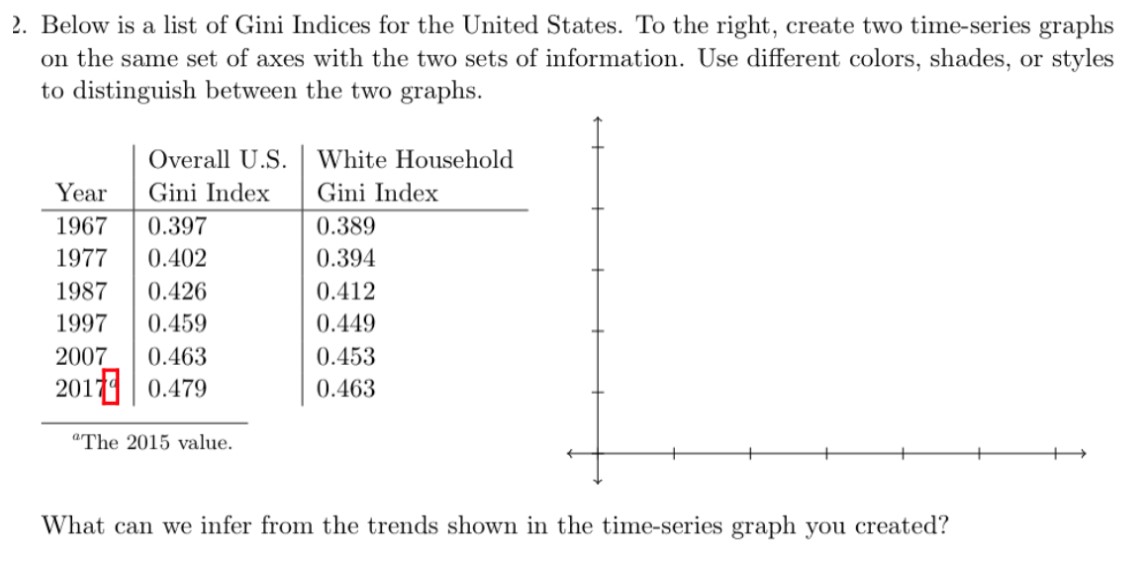
2. Below is a list of Gini Indices for the United States. To the right, create two time-series graphs on the same set of axes with the two sets of information. Use different colors, shades, or styles to distinguish between the two graphs. Overall U.S. White Household Year Gini Index Gini Index 1967 0.397 0.389 1977 0.402 0.394 1987 0.426 0.412 1997 0.459 0.449 2007 0.463 0.453 2017 0.479 0.463 "The 2015 value. What can we infer from the trends shown in the time-series graph you created?
Step by Step Solution
There are 3 Steps involved in it
Step: 1

Get Instant Access to Expert-Tailored Solutions
See step-by-step solutions with expert insights and AI powered tools for academic success
Step: 2

Step: 3

Ace Your Homework with AI
Get the answers you need in no time with our AI-driven, step-by-step assistance
Get StartedRecommended Textbook for
Operations Management Managing Global Supply Chains
Authors: Ray R. Venkataraman, Jeffrey K. Pinto
1st edition
1506302935, 1506302939, 978-1506302935
Students also viewed these Mathematics questions
Question
Answered: 1 week ago
Question
Answered: 1 week ago
Question
Answered: 1 week ago
Question
Answered: 1 week ago
Question
Answered: 1 week ago
Question
Answered: 1 week ago
Question
Answered: 1 week ago
Question
Answered: 1 week ago
Question
Answered: 1 week ago
Question
Answered: 1 week ago
Question
Answered: 1 week ago
Question
Answered: 1 week ago
Question
Answered: 1 week ago
Question
Answered: 1 week ago
Question
Answered: 1 week ago
Question
Answered: 1 week ago
Question
Answered: 1 week ago
Question
Answered: 1 week ago
Question
Answered: 1 week ago
Question
Answered: 1 week ago
Question
Answered: 1 week ago
Question
Answered: 1 week ago
Question
Answered: 1 week ago
Question
Answered: 1 week ago
View Answer in SolutionInn App


