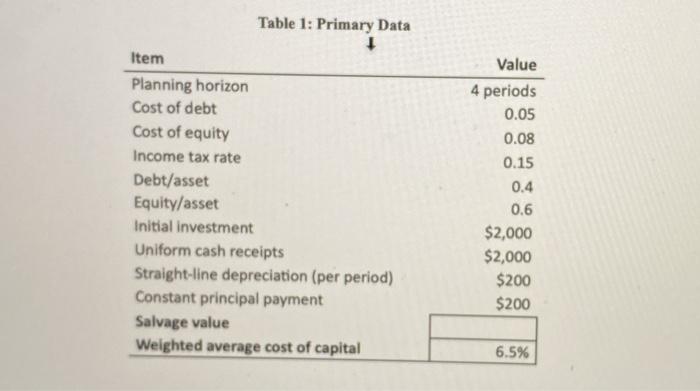
2. Calculate the interest expense, the income taxes using the ROE approach, the income taxes using the ROA approach, the net cash flow using the ROE approach, the net cash flow using the ROA approach, and the debt value for each of the four periods in the planning horizon using the primary data from Table 1. Show your work, and put your answers in the correct cells of Table 2 below. If there is any salvage value, include it in the fourth period cash flow. Table 2: ROE and ROA Net Cash Flow Analysis Item Cash receipts Cash expenses Depreciation $2,000 $1,000 $200 End of period 2 3 $2,000 $2,000 $1,000 $3,000 $200 $200 $2,000 $1,000 $200 Interest expense Income taxes (ROE) Income taxes (ROA) Principal payments Net cash flow (ROE) Net cash flow (ROA) $200 $200 $200 $200 Beginning of period 2 Item 4 Debt value Table 1: Primary Data Item Planning horizon Cost of debt Cost of equity Income tax rate Debt/asset Equity/asset Initial investment Uniform cash receipts Straight-line depreciation (per period) Constant principal payment Salvage value Weighted average cost of capital Value 4 periods 0.05 0.08 0.15 0.4 0.6 $2,000 $2,000 $200 $200 6.5% Table 1: Primary Data Item Planning horizon Cost of debt Cost of equity Income tax rate Debt/asset Equity/asset Initial investment Uniform cash receipts Straight-line depreciation (per period) Constant principal payment Salvage value Weighted average cost of capital Value 4 periods 0.05 0.08 0.15 0.4 0.6 $2,000 $2,000 $200 $200 6.5% 2. Calculate the interest expense, the income taxes using the ROE approach, the income taxes using the ROA approach, the net cash flow using the ROE approach, the net cash flow using the ROA approach, and the debt value for each of the four periods in the planning horizon using the primary data from Table 1. Show your work, and put your answers in the correct cells of Table 2 below. If there is any salvage value, include it in the fourth period cash flow. Table 2: ROE and ROA Net Cash Flow Analysis Item Cash receipts Cash expenses Depreciation $2,000 $1,000 $200 End of period 2 3 $2,000 $2,000 $1,000 $3,000 $200 $200 $2,000 $1,000 $200 Interest expense Income taxes (ROE) Income taxes (ROA) Principal payments Net cash flow (ROE) Net cash flow (ROA) $200 $200 $200 $200 Beginning of period 2 Item 4 Debt value Table 1: Primary Data Item Planning horizon Cost of debt Cost of equity Income tax rate Debt/asset Equity/asset Initial investment Uniform cash receipts Straight-line depreciation (per period) Constant principal payment Salvage value Weighted average cost of capital Value 4 periods 0.05 0.08 0.15 0.4 0.6 $2,000 $2,000 $200 $200 6.5% Table 1: Primary Data Item Planning horizon Cost of debt Cost of equity Income tax rate Debt/asset Equity/asset Initial investment Uniform cash receipts Straight-line depreciation (per period) Constant principal payment Salvage value Weighted average cost of capital Value 4 periods 0.05 0.08 0.15 0.4 0.6 $2,000 $2,000 $200 $200 6.5%


