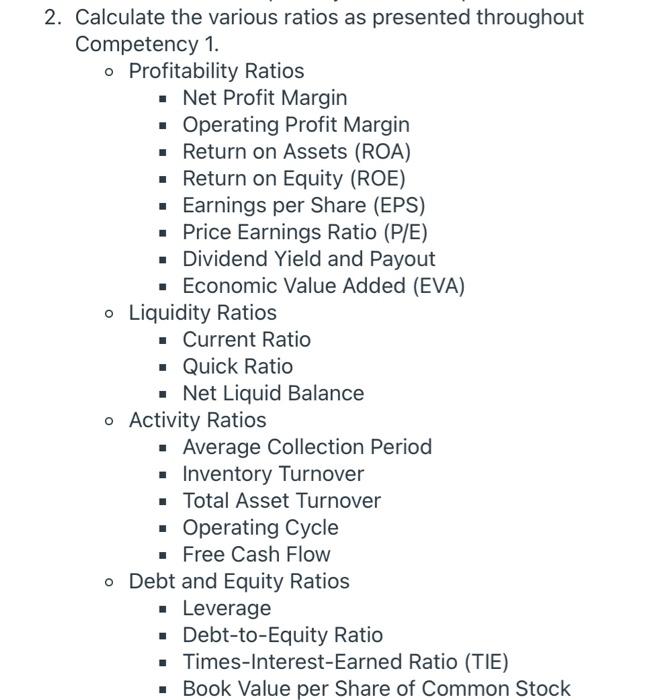
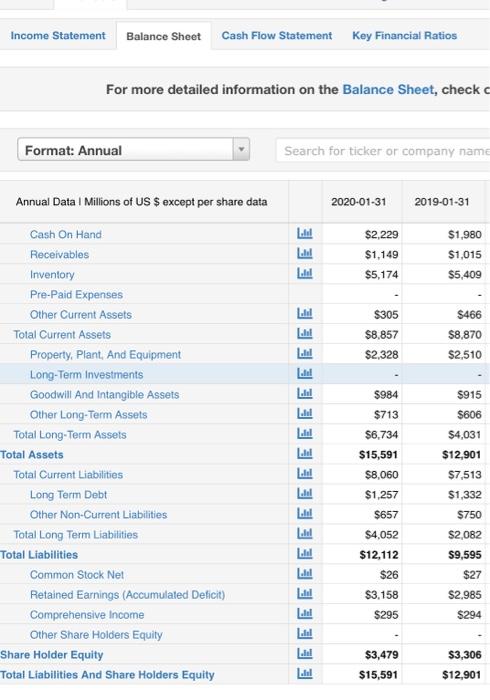
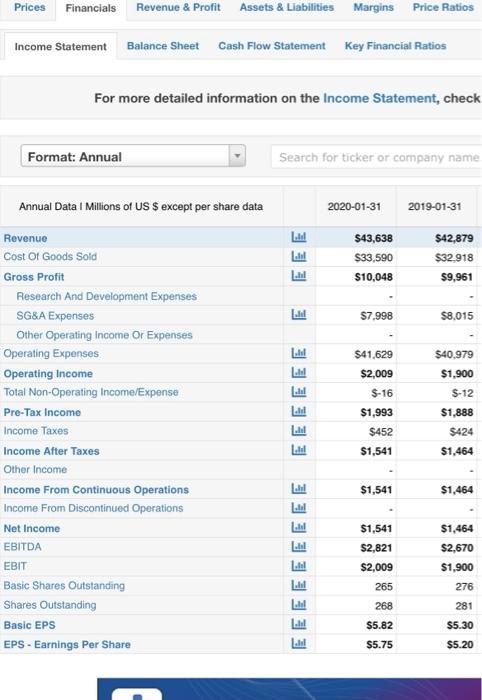
2. Calculate the various ratios as presented throughout Competency 1. o Profitability Ratios Net Profit Margin Operating Profit Margin Return on Assets (ROA) Return on Equity (ROE) Earnings per Share (EPS) Price Earnings Ratio (P/E) Dividend Yield and Payout Economic Value Added (EVA) o Liquidity Ratios Current Ratio Quick Ratio Net Liquid Balance o Activity Ratios Average Collection Period Inventory Turnover Total Asset Turnover Operating Cycle Free Cash Flow o Debt and Equity Ratios Leverage Debt-to-Equity Ratio Times-Interest-Earned Ratio (TIE) Book Value per Share of Common Stock Income Statement Balance Sheet Cash Flow Statement Key Financial Ratios For more detailed information on the Balance Sheet, check Format: Annual Search for ticker or company name Annual Data 1 Millions of US $ except per share data 2020-01-31 2019-01-31 1.0.1 . $2,229 $1,149 $1,980 $1,015 $5,409 I. $5,174 1.1 $466 J. $305 $8,857 $2,328 1. $8,870 $2,510 J. $984 $915 J. $606 Cash On Hand Receivables Inventory Pre-Paid Expenses Other Current Assets Total Current Assets Property, Plant, And Equipment Long-Term Investments Goodwill And Intangible Assets Other Long-Term Assets Total Long-Term Assets Total Assets Total Current Liabilities Long Term Debt Other Non-Current Liabilities Total Long Term Liabilities Total Liabilities Common Stock Net Retained Earnings (Accumulated Deficit) Comprehensive Income Other Share Holders Equity Share Holder Equity Total Liabilities And Share Holders Equity LU $4,031 $12,901 $7,513 $1,332 $713 $6,734 $15,591 $8,060 $1,257 $657 $4,052 $12,112 $26 $3,158 $750 $2,082 $9,595 $27 $2.985 $295 $294 EEEEE $3,479 $3,306 $12,901 $15,591 Prices Financials Revenue & Profit Assets & Liabilities Margins Price Ratios Income Statement Balance Sheet Cash Flow Statement Key Financial Ratios For more detailed information on the Income Statement, check Format: Annual Search for ticker or company name Annual Data 1 Millions of US $ except per share data 2020-01-31 2019-01-31 $43,638 $33,590 $10,048 $42,879 $32.918 $9.961 1.041 $7.998 $8.015 $41,629 $2,009 $-16 $1,993 $452 EEEEEE $40,979 $1,900 $-12 $1,888 Revenue Cost Of Goods Sold Gross Profit Research And Development Expenses SG&A Expenses Other Operating Income Or Expenses Operating Expenses Operating Income Total Non-Operating Income/Expense Pre-Tax Income Income Taxes Income After Taxes Other Income Income From Continuous Operations Income From Discontinued Operations Net Income EBITDA EBIT Basic Shares Outstanding Shares Outstanding Basic EPS EPS - Earnings Per Share $424 $1,541 $1,464 $1,541 $1,464 EEEEEE $1,541 $2,821 $2,009 $1,464 $2,670 $1,900 276 265 [al 268 281 $5.82 $5.30 EE $5.75 $5.20