

Answered step by step
Verified Expert Solution
Question
1 Approved Answer
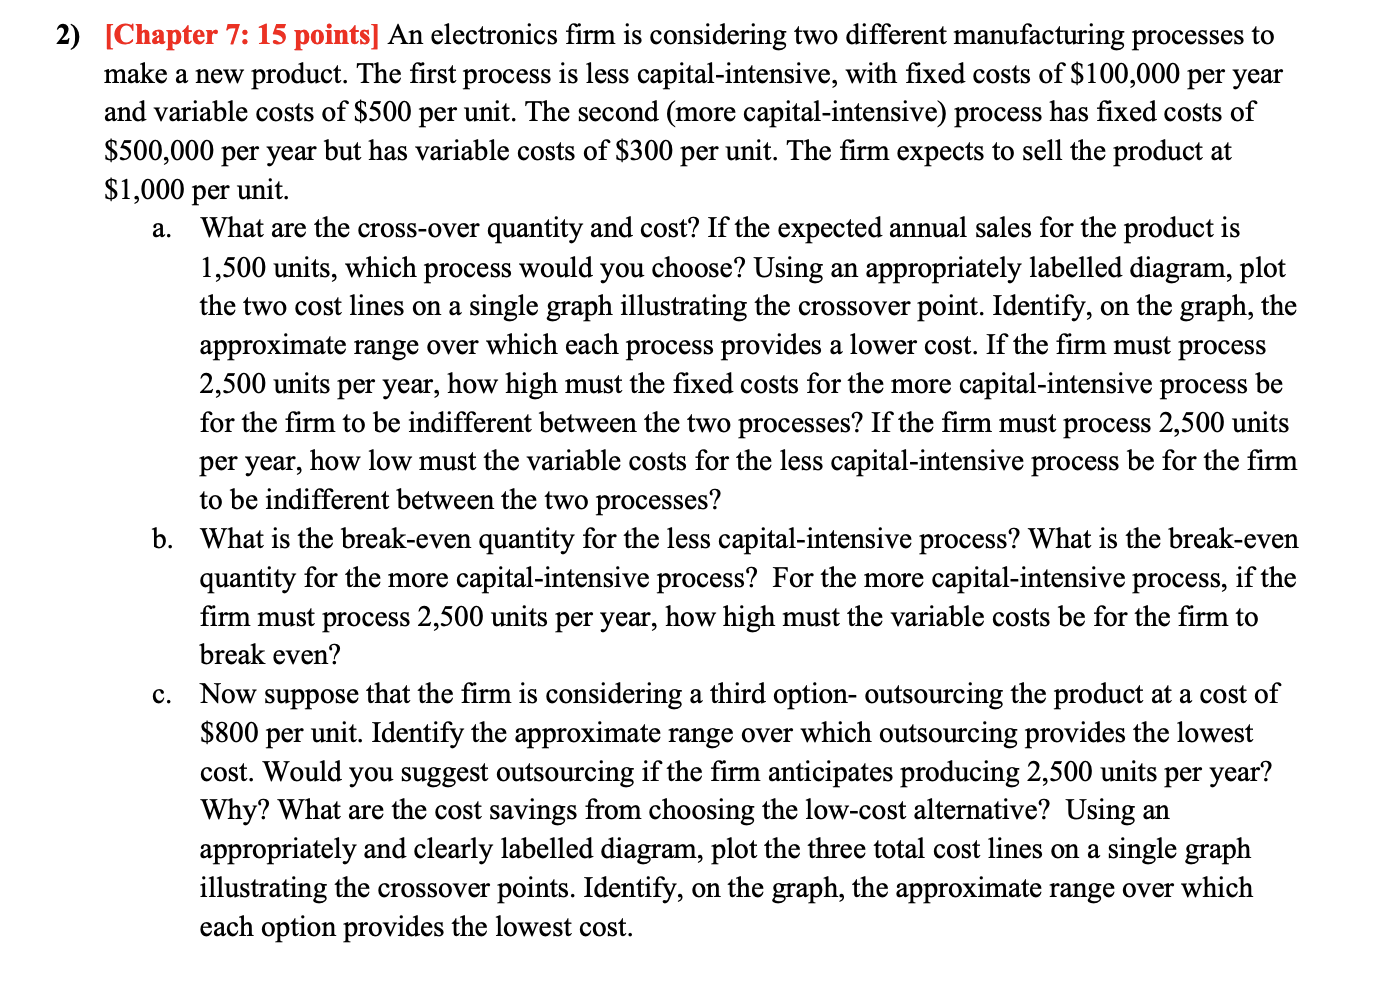
2) [Chapter 7: 15 points] An electronics rm is considering two different manufacturing processes to make a new product. The rst process is less capital-intensive,
Step by Step Solution
There are 3 Steps involved in it
Step: 1

Get Instant Access to Expert-Tailored Solutions
See step-by-step solutions with expert insights and AI powered tools for academic success
Step: 2

Step: 3
Ace Your Homework with AI
Get the answers you need in no time with our AI-driven, step-by-step assistance
Get Started
Quantitative Analysis For Management
Authors: Barry Render, Ralph M. Stair, Michael E. Hanna
11th Edition
9780132997621, 132149117, 132997622, 978-0132149112