Question
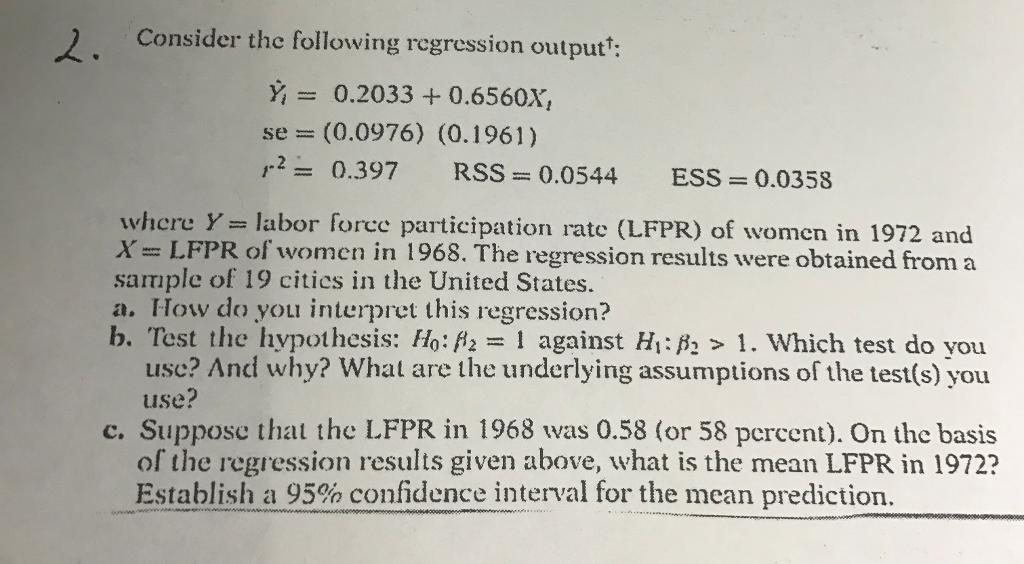
2. Consider the following regression output: = 0.2033 +0.6560X, se= (0.0976) (0.1961) - = 0.397 RSS=0.0544 ESS=0.0358 where Y= labor force participation rate (LFPR)

2. Consider the following regression output: = 0.2033 +0.6560X, se= (0.0976) (0.1961) - = 0.397 RSS=0.0544 ESS=0.0358 where Y= labor force participation rate (LFPR) of women in 1972 and X= LFPR of women in 1968. The regression results were obtained from a sample of 19 cities in the United States. a. How do you interpret this regression? b. Test the hypothesis: Ho: 2 = 1 against H: B > 1. Which test do you use? And why? What are the underlying assumptions of the test(s) you use? c. Suppose that the LFPR in 1968 was 0.58 (or 58 percent). On the basis of the regression results giv above, what is the mean LFPR in 1972? Establish a 95% confidence interval for the mean prediction.
Step by Step Solution
3.43 Rating (156 Votes )
There are 3 Steps involved in it
Step: 1

Get Instant Access to Expert-Tailored Solutions
See step-by-step solutions with expert insights and AI powered tools for academic success
Step: 2

Step: 3

Ace Your Homework with AI
Get the answers you need in no time with our AI-driven, step-by-step assistance
Get StartedRecommended Textbook for
Stats Data And Models
Authors: Richard D. De Veaux, Paul D. Velleman, David E. Bock
4th Edition
321986490, 978-0321989970, 032198997X, 978-0321986498
Students also viewed these Accounting questions
Question
Answered: 1 week ago
Question
Answered: 1 week ago
Question
Answered: 1 week ago
Question
Answered: 1 week ago
Question
Answered: 1 week ago
Question
Answered: 1 week ago
Question
Answered: 1 week ago
Question
Answered: 1 week ago
Question
Answered: 1 week ago
Question
Answered: 1 week ago
Question
Answered: 1 week ago
Question
Answered: 1 week ago
Question
Answered: 1 week ago
Question
Answered: 1 week ago
Question
Answered: 1 week ago
Question
Answered: 1 week ago
Question
Answered: 1 week ago
Question
Answered: 1 week ago
View Answer in SolutionInn App


