

Answered step by step
Verified Expert Solution
Question
1 Approved Answer
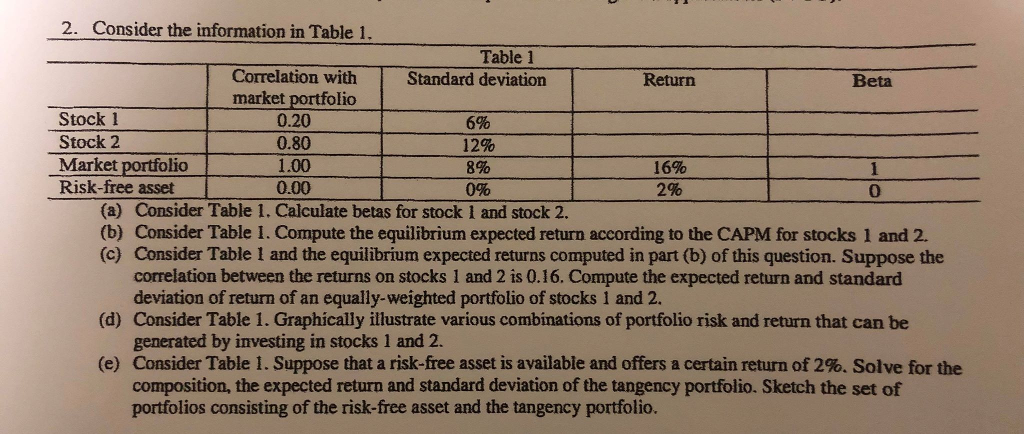
2. Consider the information in Table 1 Table 1 Correlation with market portfolio 0.20 0.80 1.00 0.00 Standard deviation Return Beta Stock 1 Stock 2
Step by Step Solution
There are 3 Steps involved in it
Step: 1

Get Instant Access to Expert-Tailored Solutions
See step-by-step solutions with expert insights and AI powered tools for academic success
Step: 2

Step: 3
Ace Your Homework with AI
Get the answers you need in no time with our AI-driven, step-by-step assistance
Get Started
Focus On Personal Finance
Authors: Jack Kapoor, Les Dlabay, Robert J. Hughes
2nd Edition
0073530638, 9780073530635