Answered step by step
Verified Expert Solution
Question
1 Approved Answer
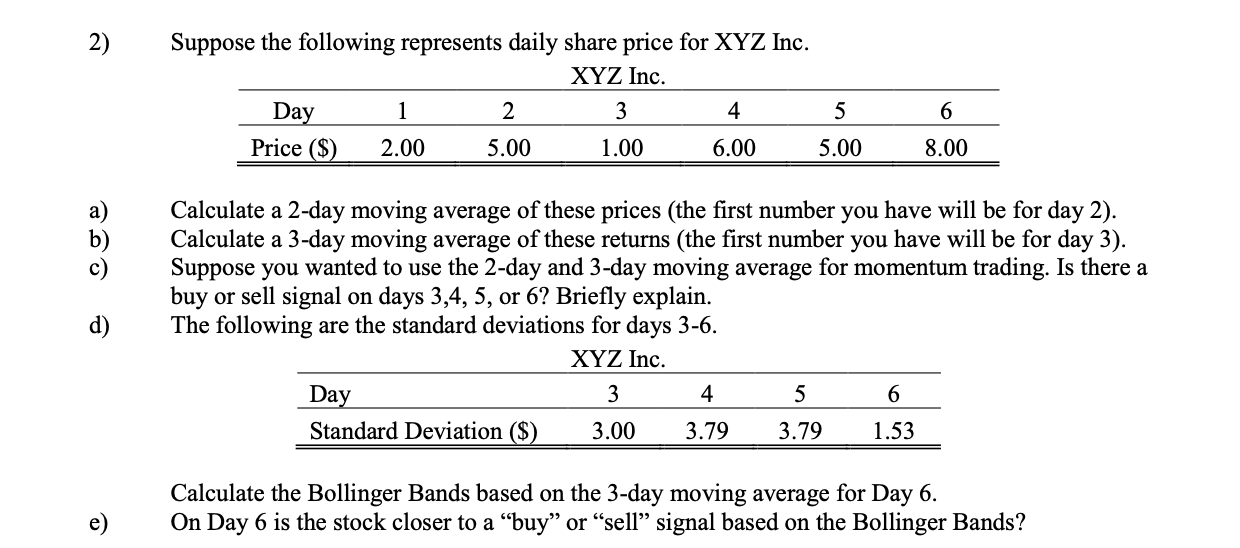
2) Suppose the following represents daily share price for XYZ Inc. 830 XYZ Inc. Day 1 2 3 4 5 6 Price ($) 2.00

2) Suppose the following represents daily share price for XYZ Inc. 830 XYZ Inc. Day 1 2 3 4 5 6 Price ($) 2.00 5.00 1.00 6.00 5.00 8.00 Calculate a 2-day moving average of these prices (the first number you have will be for day 2). Calculate a 3-day moving average of these returns (the first number you have will be for day 3). Suppose you wanted to use the 2-day and 3-day moving average for momentum trading. Is there a buy or sell signal on days 3,4, 5, or 6? Briefly explain. d) The following are the standard deviations for days 3-6. XYZ Inc. Day 3 4 5 6 Standard Deviation ($) 3.00 3.79 3.79 1.53 Calculate the Bollinger Bands based on the 3-day moving average for Day 6. On Day 6 is the stock closer to a buy or sell signal based on the Bollinger Bands?
Step by Step Solution
★★★★★
3.37 Rating (150 Votes )
There are 3 Steps involved in it
Step: 1
a To calculate the 2day moving average we take the average of the current days price and the price from the previous day 2day moving average for Day 2 ...
Get Instant Access to Expert-Tailored Solutions
See step-by-step solutions with expert insights and AI powered tools for academic success
Step: 2

Step: 3

Ace Your Homework with AI
Get the answers you need in no time with our AI-driven, step-by-step assistance
Get Started


