

Answered step by step
Verified Expert Solution
Question
1 Approved Answer
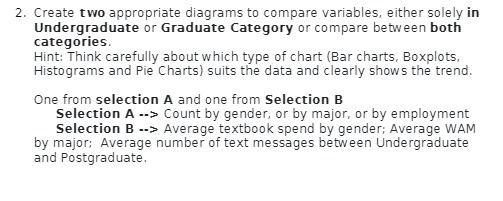
2. Create two appropriate diagrams to compare variables, either solely in Undergraduate or Graduate Category or compare between both categories. Hint: Think carefully about which

Step by Step Solution
There are 3 Steps involved in it
Step: 1

Get Instant Access to Expert-Tailored Solutions
See step-by-step solutions with expert insights and AI powered tools for academic success
Step: 2

Step: 3
Ace Your Homework with AI
Get the answers you need in no time with our AI-driven, step-by-step assistance
Get Started
Trigonometry (Subscription)
Authors: Mark Dugopolski
5th Edition
0135207487, 9780135207482