Answered step by step
Verified Expert Solution
Link Copied!

Question

1 Approved Answer

2 . Data on household vehicle miles of travel (VMI ) are compiled annually by the Federal Highway Administration . A researcher is interested in
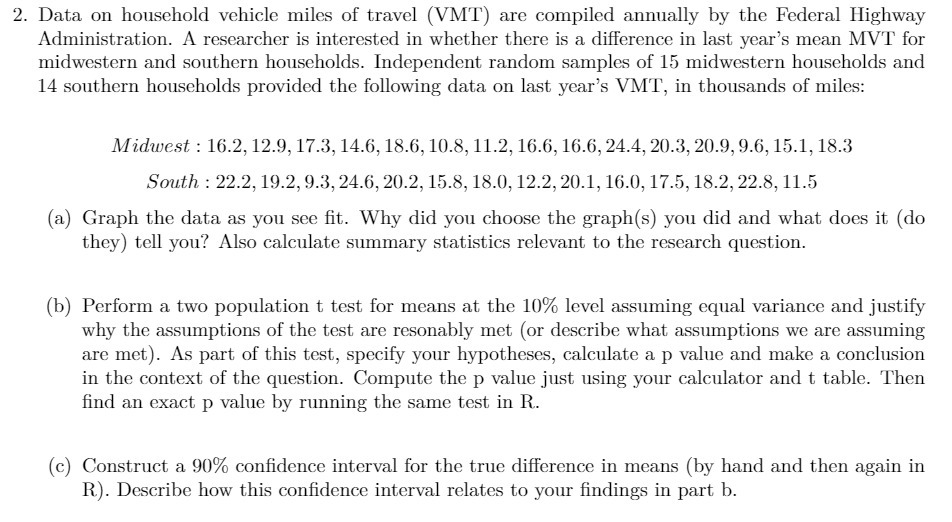
image text in transcribed
2 . Data on household vehicle miles of travel (VMI ) are compiled annually by the Federal Highway Administration . A researcher is interested in whether there is a difference in last year's mean MY I for midwestern and southern households . Independent random samples of 16 midwestern households and old 14 southern households provided the following data on last year's MI , in thousands of miles Midwest : 16 2 129 17 3 14 6 18 6 10 8 11 2 16 6 16 6 24 4 20 3 209 9 6 15 1 . 18 3 South : 22 2 19 2 93 24 6 20 . 2 15 .8 180 12.2 20 1 16 0 17 5 18 2 22.8 11.5 ( 2 ) Graph the data as you see fit . Why did you choose the graph ( s ) you did and what does it ( do they ) tell you ? Also calculate summary statistics relevant to the research question Ton ( b ) Perform a two population to test for means at the 10% level assuming equal variance and justify why the assumptions of the test are resonab ly met ( or describe what assumptions we are assuming are met ) . As part of this test , specify your hypotheses , calculate ap value and make a conclusion Delusion in the context of the question . Compute the p value just using your calculator and t table . Then find an exact p value by running the same test in R ( C ) Construct a 90% confidence interval for the true difference in means ( by hand and then again in R ) . Describe how this confidence interval relates to your findings in part b

Step by Step Solution

There are 3 Steps involved in it

Step: 1

blur-text-image

Get Instant Access to Expert-Tailored Solutions

See step-by-step solutions with expert insights and AI powered tools for academic success

Step: 2

blur-text-image

Step: 3

blur-text-image

Ace Your Homework with AI

Get the answers you need in no time with our AI-driven, step-by-step assistance

Get Started

Recommended Textbook for

Statistical Inference

Authors: George Casella, Roger L. Berger

2nd edition

0534243126, 978-0534243128

More Books

Students also viewed these Mathematics questions