Answered step by step
Verified Expert Solution
Question
1 Approved Answer
[2] Data were collected from a random sample of 220 home sales from a community in 2013. Let Price denote the selling price (in

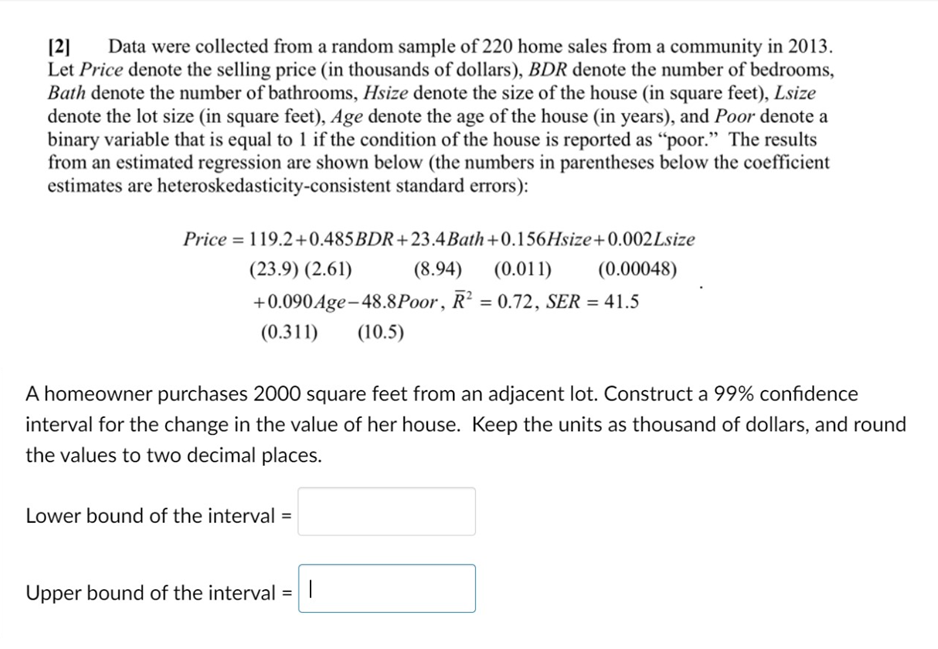
[2] Data were collected from a random sample of 220 home sales from a community in 2013. Let Price denote the selling price (in thousands of dollars), BDR denote the number of bedrooms, Bath denote the number of bathrooms, Hsize denote the size of the house (in square feet), Lsize denote the lot size (in square feet), Age denote the age of the house (in years), and Poor denote a binary variable that is equal to 1 if the condition of the house is reported as "poor." The results from an estimated regression are shown below (the numbers in parentheses below the coefficient estimates are heteroskedasticity-consistent standard errors): Price =119.2+0.485BDR+23.4 Bath+0.156Hsize+0.002Lsize (23.9) (2.61) (8.94) (0.011) (0.00048) +0.090 Age-48.8Poor, R2 = 0.72, SER = 41.5 (0.311) (10.5) A homeowner purchases 2000 square feet from an adjacent lot. Construct a 99% confidence interval for the change in the value of her house. Keep the units as thousand of dollars, and round the values to two decimal places. Lower bound of the interval = Upper bound of the interval = |
Step by Step Solution
There are 3 Steps involved in it
Step: 1

Get Instant Access to Expert-Tailored Solutions
See step-by-step solutions with expert insights and AI powered tools for academic success
Step: 2

Step: 3

Ace Your Homework with AI
Get the answers you need in no time with our AI-driven, step-by-step assistance
Get Started


