Answered step by step
Verified Expert Solution
Question
1 Approved Answer
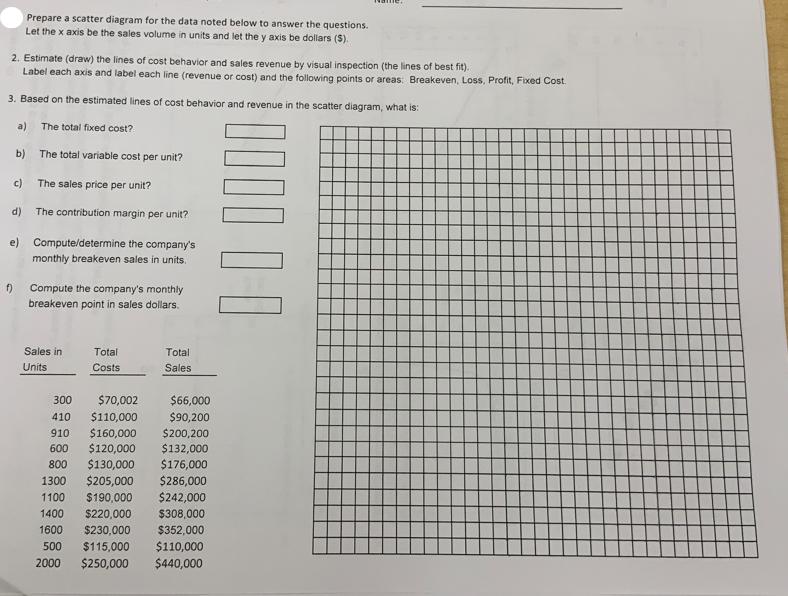
2. Estimate (draw) the lines of cost behavior and sales revenue by visual inspection (the lines of best fit). Label each axis and label

2. Estimate (draw) the lines of cost behavior and sales revenue by visual inspection (the lines of best fit). Label each axis and label each line (revenue or cost) and the following points or areas: Breakeven, Loss, Profit, Fixed Cost. 3. Based on the estimated lines of cost behavior and revenue in the scatter diagram, what is: 1 a) The total fixed cost? b) The total variable cost per unit? c) The sales price per unit? The contribution margin per unit? d) Prepare a scatter diagram for the data noted below to answer the questions. Let the x axis be the sales volume in units and let the y axis be dollars ($). e) Compute/determine the company's monthly breakeven sales in units. f) Compute the company's monthly breakeven point in sales dollars. Sales in Units Total Costs 300 $70,002 410 $110,000 910 $160,000 600 $120,000 800 $130,000 1300 $205,000 1100 $190,000 1400 $220,000 1600 $230,000 500 $115,000 2000 Total Sales $66,000 $90,200 $200,200 $132,000 $176,000 $286,000 $242,000 $308,000 $352,000 $110,000 $250,000 $440,000 100000
Step by Step Solution
There are 3 Steps involved in it
Step: 1
I can help explain how to determine the answers to these questions based on the scatter diagram you will create and the data given but since I cant physically draw the lines on the provided chart I wi...
Get Instant Access to Expert-Tailored Solutions
See step-by-step solutions with expert insights and AI powered tools for academic success
Step: 2

Step: 3

Ace Your Homework with AI
Get the answers you need in no time with our AI-driven, step-by-step assistance
Get Started


