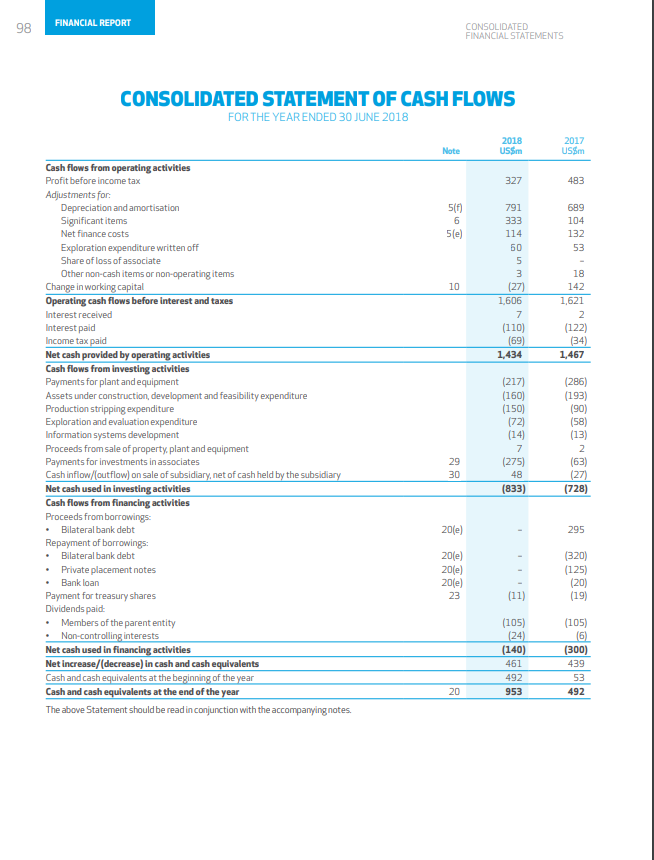
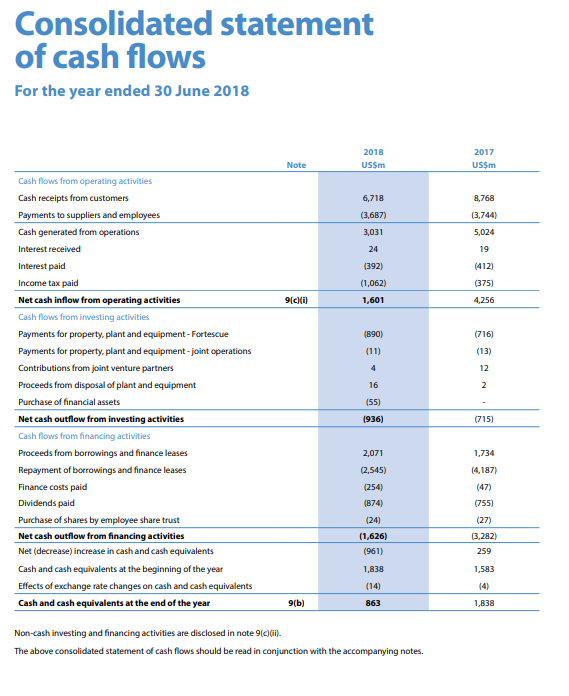
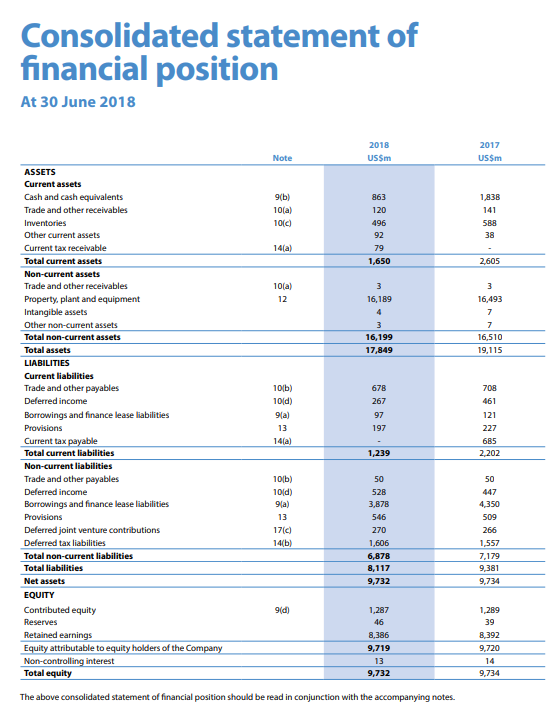
2. Examine the information in relation to cash flow from operating activities, cash flow from investing activities and cash flow from financing activities retrieved from the Newcrest Mining and Fortescue Metals Group financial reports and undertake a written analysis of the cash flow statement information given for Newcrest Mining and Fortescue Metals Group. Include in this analysis the computations of measuring Working Capital Ratio, Cash Flow Adequacy Ratio (Liquidity), Debt to Total Assets Ratio, Debt Coverage Ratio (Solvency), and the Cash Flow to Sales Ratio (Profitability). Comment on your findings related to these ratios.
- Based on the analysis, you are required to make conclusions and recommendation which will answer the following questions:
- Which business would you expect to be a better short-term credit risk?
- Do you think both companies have adequate cash resources?
- Assess both companies ability to survive in the longer term.
- Which company is better at generating cash from their sales revenue?
Newcrest Mining
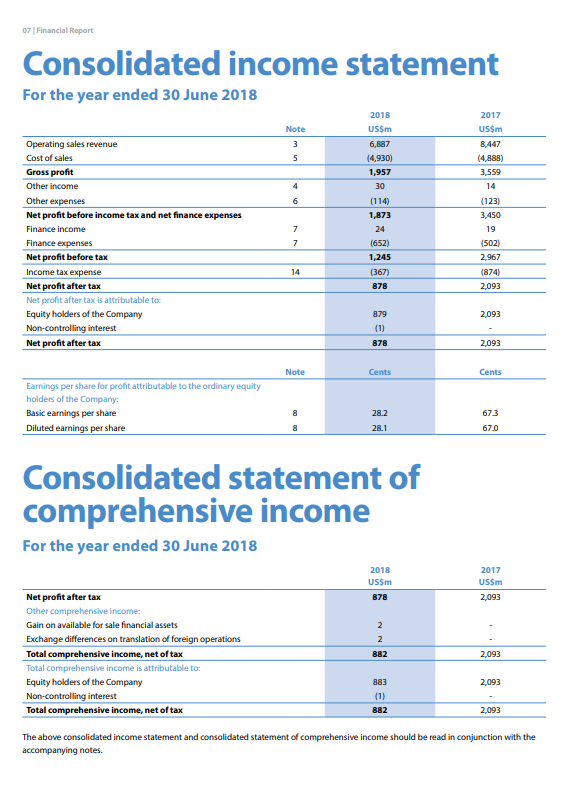
Fortescue Metals
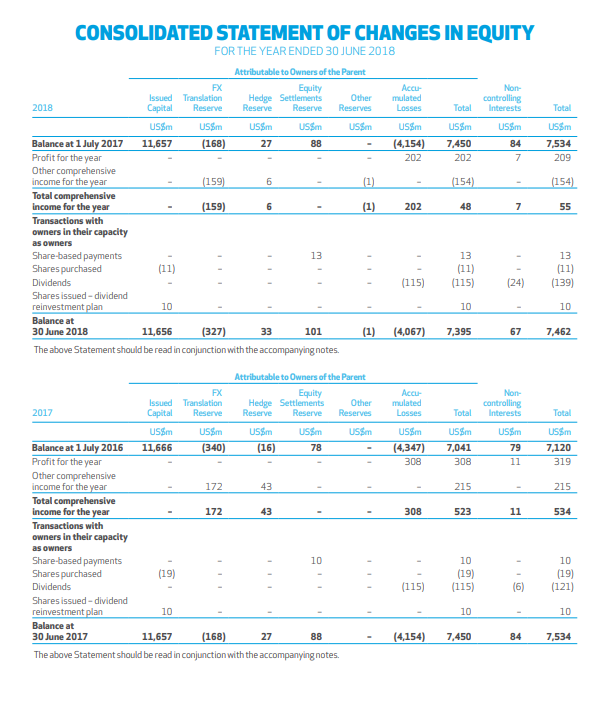
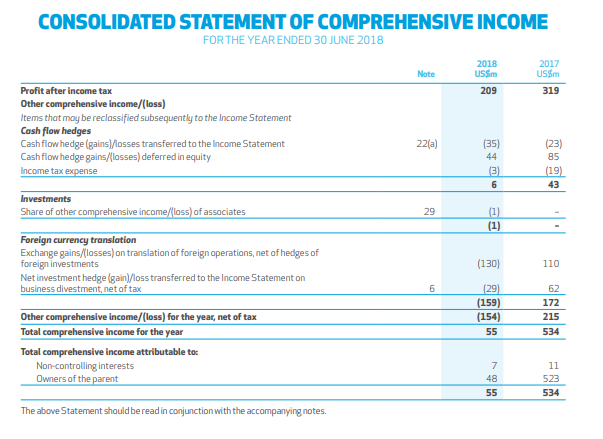
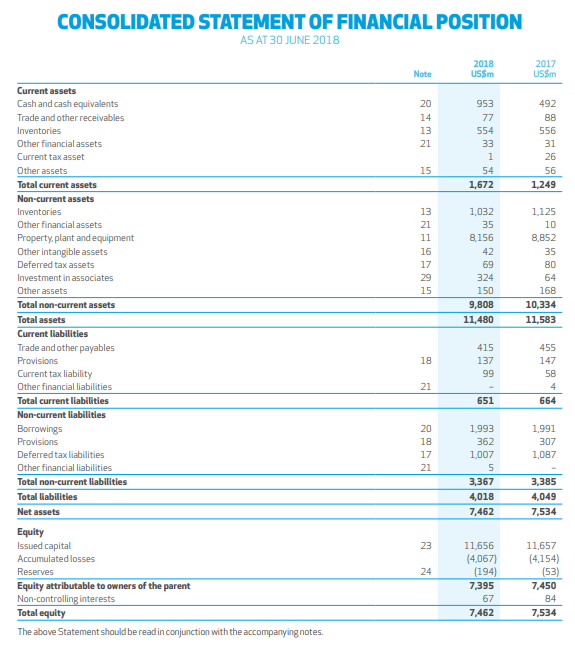
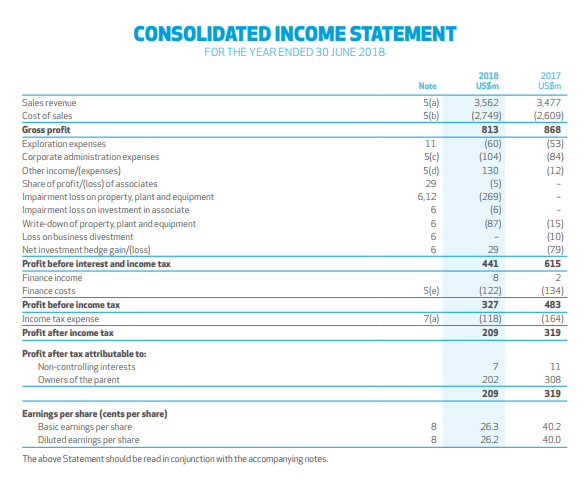
CONSOLIDATED STATEMENT OF CHANGES IN EQUITY FOR THE YEAR ENDED 30 JUNE 2018 Attributable to Owners of the Parent FX Issued Translation Reserve Equity Hedge Settlements Reserve Accu mulated Non- Other controlling Interests Reserve 2018 Capital Reserves Losses Total Total US$m USSM UsSm USSm USSm UsSm usSm USSm US$m Balance at 1 July 2017 Profit for the year (168) (4,154) 11,657 27 88 7,450 84 7,534 202 202 7 209 Other comprehensive income for the year (159) (1) (154) (154) 6 Total comprehensive income for the year (159) (1) 6 202 48 7 55 Transactions with owners in their capacity as owners Share-based payments Shares purchased 13 13 13 (11) (11) (115) (11) (139) (115) (24) Dividends Shares issued-dividend reinvestment plan 10 10 10 Balance at (327) (1) (4,067) 30 June 2018 11,656 33 101 7,395 67 7,462 The above Statement should be read in conjunction with the accompanying notes Attributable to Owners of the Parent FX Issued Translation Equity Hedge Settlements Reserve Accu mulated Losses Non- controlling Interests Other Reserves Reserve 2017 Capital Reserve Total Total USSm USSm USSM US$m US$m USSm US$m US$m Us$m (4,347) Balance at 1 July 2016 Profit for the year Other comprehensive income for the year Total comprehensive income for the year (340) (16) 11,666 78 7,041 79 7,120 308 308 11 319 172 43 215 215 172 43 308 523 11 534 Transactions with owners in their capacity as owners Share-based payments Shares purchased Dividends 10 10 10 (19) (19) (115) (19) (121) (115) (6 Shares issued-dividend reinvestment plan 10 10 10 Balance at (168) (4,154) 30 June 2017 11,657 27 88 7,450 84 7,534 The above Statement should be read in conjunction with the accompanying notes. CONSOLIDATED STATEMENT OF COMPREHENSIVE INCOME FOR THE YEAR ENDED 30 JUNE 2018 2018 2017 US$m USSm Note Profit after income tax 209 319 Other comprehensive income/(loss) Items that may be reclassified subsequently to the Income Statement Cash flow hedges Cash flow hedge (gains)Mosses transferred to the Income Statement Cash flow hedge gains/[lasses) deferred in equity 22(a) (35) (23) 44 85 3 (19) Income tax expense 6 43 Investments Share of other comprehensive income/loss) of associates (1) (1) 29 Foreign currency translation Exchange gains/losses) on translation of foreign operations, net of hedges of foreign investments Net investment hedge (gain)/loss transferred to the Income Statement on business divestment, net of tax (130) 110 (29) (159) (154) 6 62 172 Other comprehensive income/(loss) for the year, net of tax Total comprehensive income for the year 215 55 534 Total comprehensive income attributable to: Non-controlling interests Owners of the parent 7 11 523 48 55 534 The above Statement should be read in conjunction with the accompanying notes. CONSOLIDATED STATEMENT OF FINANCIAL POSITION AS AT 30 JUNE 2018 2018 2017 US$m USSm Note Current assets Cash and cash equivalents 20 953 492 Trade and other receivables 14 77 88 Inventories 13 554 556 Other financial assets 21 33 31 Current tax asset 1 26 Other assets 15 54 56 1,672 Total current assets 1,249 Non-current assets 1,125 Inventories 13 1,032 Other financial assets 21 35 10 8,852 Property.plant and equipment 11 8,156 Other intangible assets 16 42 35 Deferred tax assets 17 69 80 Investment in associates 29 324 64 150 Other assets 15 168 Total non-current assets 9,808 10,334 Total assets 11,480 11,583 Current liabilities Trade and other payables 415 455 Provisions 18 137 147 Current tax liability Other financial liabilities 99 58 21 4 Total current liabilities 651 664 Non-current liabilities Borrowings 20 1,993 1,991 Provisions 18 362 307 Deferredtax liabilities 17 1,007 1,087 Other financial liabilities 21 Total non-current liabilities 3,367 3,385 Total liabilities 4,018 4,049 Net assets 7,462 7,534 Equity Issued capital 23 11,656 11,657 (4,067) (194) (4,154) (53) Accumulated losses Reserves 24 Equity attributable to owners of the parent 7,395 7,450 Non-controlling interests Total equity 67 84 7,534 7,462 The above Statement should be read in conjunction with the accompanying notes CONSOLIDATED INCOME STATEMENT FOR THE YEAR ENDED 30 JUNE 2018 2018 2017 US$m US$m Note 5(a) 5(b) Sales revenue 3,562 3,477 (2749) (2,609) Cost of sales Gross profit Exploration expenses Corporate administration expenses Other income/lexpenses) Share of profit/lloss) of associates Impairment loss on property, plant and equipment Impairment loss on investment in associate 813 868 (60) (104) (53) (84) (12) 11 5(c) 5(d) 130 (5) (269) (6) (87) 29 6,12 Write-down of property, plant and equipment (15) (10) (79) Loss on business divestment 6 Net investment hedge gain/(loss) 29 Profit before interest and income tax 441 615 Finance income 5le) (122) (134) Finance costs Profit before income tax 327 483 Income tax expense 7(a) (118) (164) Profit after income tax 209 319 Profit after tax attributable to: Non-controlling interests Owners of the parent 7 11 202 308 209 319 Earnings per share (cents per share) Basic earnings per share 26.3 40.2 Diluted earnings per share 26.2 40.0 The above Statement should be read in conjunction with the accompanying notes. FINANCIAL REPORT 98 CONSOLIDATED FINANCIAL STATEMENTS CONSOLIDATED STATEMENT OF CASH FLOWS FOR THE YEAR ENDED 30 JUNE 2018 2018 2017 Us$m USSM Note Cash flows from operating activities 483 Profit before income tax 327 Adjustments for Depreciation and amortisation 5(f) 791 689 Significant items Net finance costs 6 333 104 5(e) 114 132 Exploration expenditure written off 60 53 Share of loss of associate Other non-cash items or non-operating items Change in working capital Operating cash flows before interest and taxes 18 (27) 10 142 1,606 1,621 Interest received 7 2 Interest paid Income tax paid Net cash provided by operating activities Cash flows from investing activities Payments for plant and equipment Assets under construction, development and feasibility expenditure Production stripping expenditure Exploration and evaluation expenditure Information systems development Proceeds from sale of property, plant and equipment Payments for investments in associates Cash inflow/loutflow) on sale of subsidiary, net of cash held by the subsidiary Net cash used in investing activities Cash flows from financing activities Proceeds from borrawings Bilateral bank debt Repayment of borrowings: Bilateral bank debt (110) (69) (122) (34) 1,434 1,467 (217) (160) (150) (72) (14) (286) (193) (90) (58) (13) 7 2 (275) (63) (27) (728) 29 30 48 (833) 20(e) 295 (320) (125) (20) (19) 20(e) 20(e) 20(e) Private placement notes Bank loan (11) Payment for treasury shares Dividends paid Members of the parent entity Non-controlling interests Net cash used in financing activities Net increase/(decrease) in cash and cash equivalents Cash and cash equivalents at the beginning of the year 23 (105) (24) (140) (105) (6) (300) 461 439 492 53 Cash and cash equlvalents at the end of the year 20 953 492 The above Statement should be read in conjunction with the accompanying notes Consolidated statement of cash flows For the year ended 30 June 2018 2018 USS 2017 US$m Note 8,768 6,718 (3.6873 (3.744) 5,024 Cash flows from operating activities Cash receipts from customers Payments to suppliers and employees Cash generated from operations Interest received Interest paid Income tax paid Natashindow from onerating activities 3,031 24 (392) (1,062) 1,601 (412) 375) (CKD 4,256 (890) (716) (936) (715) Cash flows from investing activities Payments for property, plant and equipment - Fortescue Payments for property, plant and equipment -joint operations Contributions from joint venture partners Proceeds from disposal of plant and equipment Purchase of financial assets Net cash outflow from investing activities Cash flows from financing activities Proceeds from borrowings and finance leases Repayment of borrowings and finance leases Finance costs paid Dividends paid Purchase of shares by employee share trust Net cash outflow from financing activities Net (decrease) increase in cash and cash equivalents Cash and cash equivalents at the beginning of the year Effects of exchange rate changes on cash and cash equivalents Cash and cash equivalents at the end of the year 2,071 (2,545) (254) (874) (24) (1,626) (961) 1,734 (4,187) (47) (755) (27) 13.282) 259 1,838 1.583 (14) (4) 9(b) 863 1,838 Non-cash investing and financing activities are disclosed in note 9(c)(ii). The above consolidated statement of cash flows should be read in conjunction with the accompanying notes. Consolidated statement of financial position At 30 June 2018 2017 2018 US$m US$m Note ASSETS Current assets Cash and cash equivalents 9(b) 863 1,838 Trade and other receivables 10(a) 120 141 Inventories 10(c) 496 588 Other current assets 92. 38 Current tax receivable 14(a) 79 Total current assets 1,650 2,605 Non-current assets Trade and other receivables 10(a) 3 Property. plant and equipment 16,493 12 16,189 4 Intangible assets 7 Other non-current assets 3 7 Total non-current assets 16,199 16,510 Total assets 17,849 19,115 LIABILITIES Current liabilities Trade and other payables 10(b) 678 708 Deferred income 10ld) 267 461 Borrowings and finance lease liabilities 9la) 97 121 Provisions 13 197 227 Current tax payable 14(a) 685 Total current liabilities 1,239 2,202 Non-current liabilities Trade and other payables 10(b) 50 50 Deferred income 10ld) 528 447 9a) Borrowings and finance lease liabilities 3,878 4,350 Provisions 13 546 509 Deferred joint venture contributions 17(c) 270 266 Deferred tax liabilities 14(b) 1,606 1,557 Total non-current liabilities 6,878 7,179 Total liabilities 8,117 9,381 Net assets 9,732 9,734 EQUITY Contributed equity 9(d) 1,287 1.289 Reserves 46 39 Retained earnings Equity attributable to equity holders of the Company Non-controlling interest Total equity 8,386 8,392 9,719 9,720 13 14 9,732 9,734 The above consolidated statement of financial position should be read in conjunction with the accompanying notes 07 Financial Report Consolidated income statement For the year ended 30 June 2018 2018 2017 uS$m US$m Note Operating sales revenue 6,887 8,447 3 Cost of sales 5 (4,930) (4,888) Gross profit 1,957 3,559 Other income 4 30 14 Other expenses Net profit before income tax and net finance expenses 6 (114) (123) 1,873 3,450 Finance income 7 24 19 Finance expenses 7 (652) (502) Net profit before tax 1,245 2,967 Income tax expense Net profit after tax 14 (367) (874) 878 2,093 Net profit after tax is attributable to Equity holders of the Company 879 2,093 Non-controlling interest (1) Net profit after tax 878 2093 Note Cents Cents Earnings per share for profit attributable to the ordinary equity holders of the Company Basic earnings per share 8 28.2 673 Diluted earnings per share 28.1 670 Consolidated statement of comprehensive income For the year ended 30 June 2018 2017 uS$m 2018 us$m Net profit after tax 878 2,093 Other comprehensive income Gain on available for sale financial assets Exchange differences on translation of foreign operations 2 Total comprehensive income, net of tax 2,093 882 Total comprehensive income is attributable to: Equity holders of the Company 883 2.093 Non-controlling interest (1) Total comprehensive income, net of tax 2,093 882 The above consolidated income statement and consolidated statement of comprehensive income should be read in conjunction with the accompanying notes. NN E CONSOLIDATED STATEMENT OF CHANGES IN EQUITY FOR THE YEAR ENDED 30 JUNE 2018 Attributable to Owners of the Parent FX Issued Translation Reserve Equity Hedge Settlements Reserve Accu mulated Non- Other controlling Interests Reserve 2018 Capital Reserves Losses Total Total US$m USSM UsSm USSm USSm UsSm usSm USSm US$m Balance at 1 July 2017 Profit for the year (168) (4,154) 11,657 27 88 7,450 84 7,534 202 202 7 209 Other comprehensive income for the year (159) (1) (154) (154) 6 Total comprehensive income for the year (159) (1) 6 202 48 7 55 Transactions with owners in their capacity as owners Share-based payments Shares purchased 13 13 13 (11) (11) (115) (11) (139) (115) (24) Dividends Shares issued-dividend reinvestment plan 10 10 10 Balance at (327) (1) (4,067) 30 June 2018 11,656 33 101 7,395 67 7,462 The above Statement should be read in conjunction with the accompanying notes Attributable to Owners of the Parent FX Issued Translation Equity Hedge Settlements Reserve Accu mulated Losses Non- controlling Interests Other Reserves Reserve 2017 Capital Reserve Total Total USSm USSm USSM US$m US$m USSm US$m US$m Us$m (4,347) Balance at 1 July 2016 Profit for the year Other comprehensive income for the year Total comprehensive income for the year (340) (16) 11,666 78 7,041 79 7,120 308 308 11 319 172 43 215 215 172 43 308 523 11 534 Transactions with owners in their capacity as owners Share-based payments Shares purchased Dividends 10 10 10 (19) (19) (115) (19) (121) (115) (6 Shares issued-dividend reinvestment plan 10 10 10 Balance at (168) (4,154) 30 June 2017 11,657 27 88 7,450 84 7,534 The above Statement should be read in conjunction with the accompanying notes. CONSOLIDATED STATEMENT OF COMPREHENSIVE INCOME FOR THE YEAR ENDED 30 JUNE 2018 2018 2017 US$m USSm Note Profit after income tax 209 319 Other comprehensive income/(loss) Items that may be reclassified subsequently to the Income Statement Cash flow hedges Cash flow hedge (gains)Mosses transferred to the Income Statement Cash flow hedge gains/[lasses) deferred in equity 22(a) (35) (23) 44 85 3 (19) Income tax expense 6 43 Investments Share of other comprehensive income/loss) of associates (1) (1) 29 Foreign currency translation Exchange gains/losses) on translation of foreign operations, net of hedges of foreign investments Net investment hedge (gain)/loss transferred to the Income Statement on business divestment, net of tax (130) 110 (29) (159) (154) 6 62 172 Other comprehensive income/(loss) for the year, net of tax Total comprehensive income for the year 215 55 534 Total comprehensive income attributable to: Non-controlling interests Owners of the parent 7 11 523 48 55 534 The above Statement should be read in conjunction with the accompanying notes. CONSOLIDATED STATEMENT OF FINANCIAL POSITION AS AT 30 JUNE 2018 2018 2017 US$m USSm Note Current assets Cash and cash equivalents 20 953 492 Trade and other receivables 14 77 88 Inventories 13 554 556 Other financial assets 21 33 31 Current tax asset 1 26 Other assets 15 54 56 1,672 Total current assets 1,249 Non-current assets 1,125 Inventories 13 1,032 Other financial assets 21 35 10 8,852 Property.plant and equipment 11 8,156 Other intangible assets 16 42 35 Deferred tax assets 17 69 80 Investment in associates 29 324 64 150 Other assets 15 168 Total non-current assets 9,808 10,334 Total assets 11,480 11,583 Current liabilities Trade and other payables 415 455 Provisions 18 137 147 Current tax liability Other financial liabilities 99 58 21 4 Total current liabilities 651 664 Non-current liabilities Borrowings 20 1,993 1,991 Provisions 18 362 307 Deferredtax liabilities 17 1,007 1,087 Other financial liabilities 21 Total non-current liabilities 3,367 3,385 Total liabilities 4,018 4,049 Net assets 7,462 7,534 Equity Issued capital 23 11,656 11,657 (4,067) (194) (4,154) (53) Accumulated losses Reserves 24 Equity attributable to owners of the parent 7,395 7,450 Non-controlling interests Total equity 67 84 7,534 7,462 The above Statement should be read in conjunction with the accompanying notes CONSOLIDATED INCOME STATEMENT FOR THE YEAR ENDED 30 JUNE 2018 2018 2017 US$m US$m Note 5(a) 5(b) Sales revenue 3,562 3,477 (2749) (2,609) Cost of sales Gross profit Exploration expenses Corporate administration expenses Other income/lexpenses) Share of profit/lloss) of associates Impairment loss on property, plant and equipment Impairment loss on investment in associate 813 868 (60) (104) (53) (84) (12) 11 5(c) 5(d) 130 (5) (269) (6) (87) 29 6,12 Write-down of property, plant and equipment (15) (10) (79) Loss on business divestment 6 Net investment hedge gain/(loss) 29 Profit before interest and income tax 441 615 Finance income 5le) (122) (134) Finance costs Profit before income tax 327 483 Income tax expense 7(a) (118) (164) Profit after income tax 209 319 Profit after tax attributable to: Non-controlling interests Owners of the parent 7 11 202 308 209 319 Earnings per share (cents per share) Basic earnings per share 26.3 40.2 Diluted earnings per share 26.2 40.0 The above Statement should be read in conjunction with the accompanying notes. FINANCIAL REPORT 98 CONSOLIDATED FINANCIAL STATEMENTS CONSOLIDATED STATEMENT OF CASH FLOWS FOR THE YEAR ENDED 30 JUNE 2018 2018 2017 Us$m USSM Note Cash flows from operating activities 483 Profit before income tax 327 Adjustments for Depreciation and amortisation 5(f) 791 689 Significant items Net finance costs 6 333 104 5(e) 114 132 Exploration expenditure written off 60 53 Share of loss of associate Other non-cash items or non-operating items Change in working capital Operating cash flows before interest and taxes 18 (27) 10 142 1,606 1,621 Interest received 7 2 Interest paid Income tax paid Net cash provided by operating activities Cash flows from investing activities Payments for plant and equipment Assets under construction, development and feasibility expenditure Production stripping expenditure Exploration and evaluation expenditure Information systems development Proceeds from sale of property, plant and equipment Payments for investments in associates Cash inflow/loutflow) on sale of subsidiary, net of cash held by the subsidiary Net cash used in investing activities Cash flows from financing activities Proceeds from borrawings Bilateral bank debt Repayment of borrowings: Bilateral bank debt (110) (69) (122) (34) 1,434 1,467 (217) (160) (150) (72) (14) (286) (193) (90) (58) (13) 7 2 (275) (63) (27) (728) 29 30 48 (833) 20(e) 295 (320) (125) (20) (19) 20(e) 20(e) 20(e) Private placement notes Bank loan (11) Payment for treasury shares Dividends paid Members of the parent entity Non-controlling interests Net cash used in financing activities Net increase/(decrease) in cash and cash equivalents Cash and cash equivalents at the beginning of the year 23 (105) (24) (140) (105) (6) (300) 461 439 492 53 Cash and cash equlvalents at the end of the year 20 953 492 The above Statement should be read in conjunction with the accompanying notes Consolidated statement of cash flows For the year ended 30 June 2018 2018 USS 2017 US$m Note 8,768 6,718 (3.6873 (3.744) 5,024 Cash flows from operating activities Cash receipts from customers Payments to suppliers and employees Cash generated from operations Interest received Interest paid Income tax paid Natashindow from onerating activities 3,031 24 (392) (1,062) 1,601 (412) 375) (CKD 4,256 (890) (716) (936) (715) Cash flows from investing activities Payments for property, plant and equipment - Fortescue Payments for property, plant and equipment -joint operations Contributions from joint venture partners Proceeds from disposal of plant and equipment Purchase of financial assets Net cash outflow from investing activities Cash flows from financing activities Proceeds from borrowings and finance leases Repayment of borrowings and finance leases Finance costs paid Dividends paid Purchase of shares by employee share trust Net cash outflow from financing activities Net (decrease) increase in cash and cash equivalents Cash and cash equivalents at the beginning of the year Effects of exchange rate changes on cash and cash equivalents Cash and cash equivalents at the end of the year 2,071 (2,545) (254) (874) (24) (1,626) (961) 1,734 (4,187) (47) (755) (27) 13.282) 259 1,838 1.583 (14) (4) 9(b) 863 1,838 Non-cash investing and financing activities are disclosed in note 9(c)(ii). The above consolidated statement of cash flows should be read in conjunction with the accompanying notes. Consolidated statement of financial position At 30 June 2018 2017 2018 US$m US$m Note ASSETS Current assets Cash and cash equivalents 9(b) 863 1,838 Trade and other receivables 10(a) 120 141 Inventories 10(c) 496 588 Other current assets 92. 38 Current tax receivable 14(a) 79 Total current assets 1,650 2,605 Non-current assets Trade and other receivables 10(a) 3 Property. plant and equipment 16,493 12 16,189 4 Intangible assets 7 Other non-current assets 3 7 Total non-current assets 16,199 16,510 Total assets 17,849 19,115 LIABILITIES Current liabilities Trade and other payables 10(b) 678 708 Deferred income 10ld) 267 461 Borrowings and finance lease liabilities 9la) 97 121 Provisions 13 197 227 Current tax payable 14(a) 685 Total current liabilities 1,239 2,202 Non-current liabilities Trade and other payables 10(b) 50 50 Deferred income 10ld) 528 447 9a) Borrowings and finance lease liabilities 3,878 4,350 Provisions 13 546 509 Deferred joint venture contributions 17(c) 270 266 Deferred tax liabilities 14(b) 1,606 1,557 Total non-current liabilities 6,878 7,179 Total liabilities 8,117 9,381 Net assets 9,732 9,734 EQUITY Contributed equity 9(d) 1,287 1.289 Reserves 46 39 Retained earnings Equity attributable to equity holders of the Company Non-controlling interest Total equity 8,386 8,392 9,719 9,720 13 14 9,732 9,734 The above consolidated statement of financial position should be read in conjunction with the accompanying notes 07 Financial Report Consolidated income statement For the year ended 30 June 2018 2018 2017 uS$m US$m Note Operating sales revenue 6,887 8,447 3 Cost of sales 5 (4,930) (4,888) Gross profit 1,957 3,559 Other income 4 30 14 Other expenses Net profit before income tax and net finance expenses 6 (114) (123) 1,873 3,450 Finance income 7 24 19 Finance expenses 7 (652) (502) Net profit before tax 1,245 2,967 Income tax expense Net profit after tax 14 (367) (874) 878 2,093 Net profit after tax is attributable to Equity holders of the Company 879 2,093 Non-controlling interest (1) Net profit after tax 878 2093 Note Cents Cents Earnings per share for profit attributable to the ordinary equity holders of the Company Basic earnings per share 8 28.2 673 Diluted earnings per share 28.1 670 Consolidated statement of comprehensive income For the year ended 30 June 2018 2017 uS$m 2018 us$m Net profit after tax 878 2,093 Other comprehensive income Gain on available for sale financial assets Exchange differences on translation of foreign operations 2 Total comprehensive income, net of tax 2,093 882 Total comprehensive income is attributable to: Equity holders of the Company 883 2.093 Non-controlling interest (1) Total comprehensive income, net of tax 2,093 882 The above consolidated income statement and consolidated statement of comprehensive income should be read in conjunction with the accompanying notes. NN E