Answered step by step
Verified Expert Solution
Question
1 Approved Answer
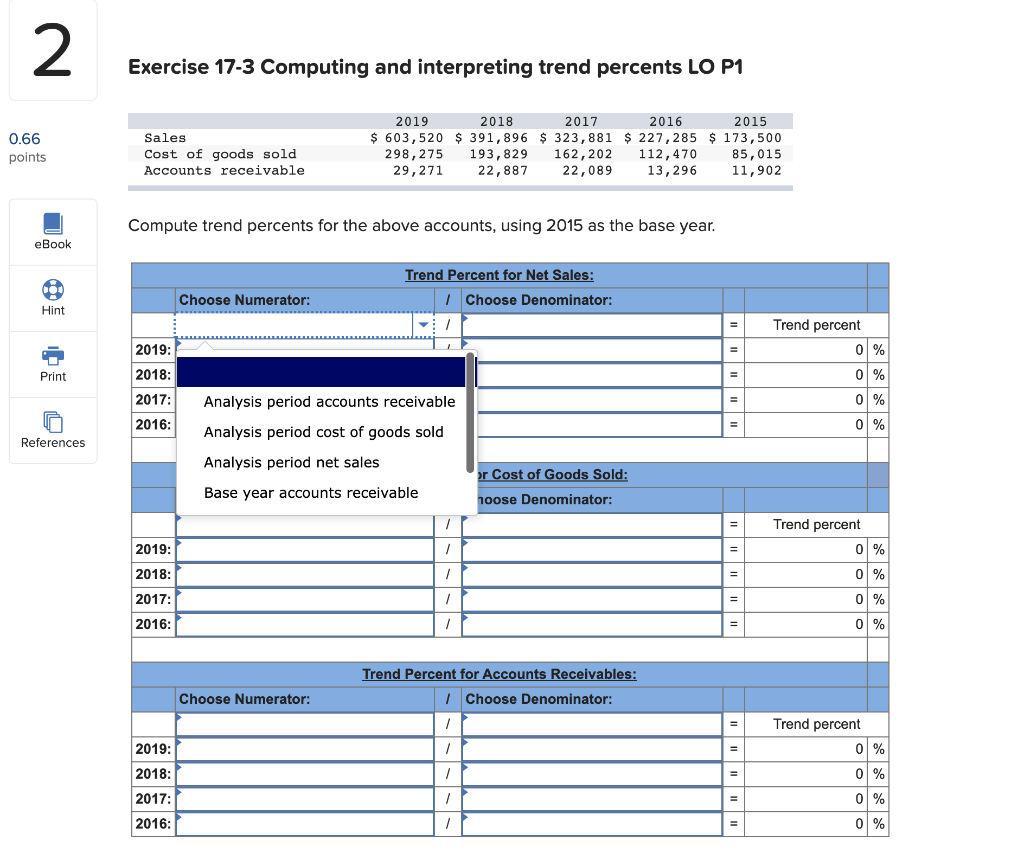
2 Exercise 17-3 Computing and interpreting trend percents LO P1 0.66 points Sales Cost of goods sold Accounts receivable 2019 2018 2017 2016 2015 $
Step by Step Solution
There are 3 Steps involved in it
Step: 1

Get Instant Access to Expert-Tailored Solutions
See step-by-step solutions with expert insights and AI powered tools for academic success
Step: 2

Step: 3
Ace Your Homework with AI
Get the answers you need in no time with our AI-driven, step-by-step assistance
Get Started