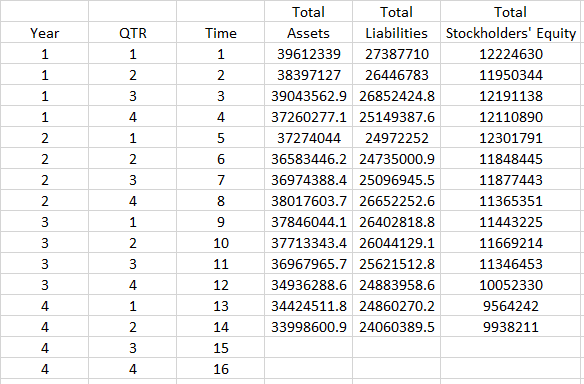


#2. Exponential Smoothing Models #2.1 Find the exponential smoothing forecasts for Total Liabilities for a = 0.4, a = 0.5, and a = 0.6 for the third period of the fourth year. a = 0.4 model: a = 0.5 model: a = 0.6 model: model #2.2 The MSE best of these three models is the a = because CEMEX S.A.B. de C.V. and subsidiaries Quarterly Balance Sheets under IFRS in thousands of U.S. dollars Year 4 3Q 4Q Total assets Cash and cash equivalents Trade receivables less allowance for doubtful accounts Other accounts receivable Inventories, net Other current assets Current assets Property, machinery and equipment, net Other assets Total liabilities Current liabilities Long-term liabilities Other liabilities Total stockholders' equity Non-controlling interest and perpetual instruments Total controlling interest 1Q 39,612,339 1,008,067 2,061,938 470,794 1,317,767 400,955 5,259,522 17,153,366 17,199,452 27,387,710 4,530,850 15,027,900 7,828,960 12,224,630 725,615 11,499,015 Year 1 20 3Q 38,397,127 39,043,563 625,081 785,237 2,169,761 2,182,687 466,507 499,675 1,304,872 1,288,113 364,590 316,330 4,930,810 5,072,043 16,586,924 16,563,208 16,879,393 17,408,311 26,446,783 26,852,425 4,015,209 4,250,027 14,850,640 14,807,684 7,580,934 7,794,713 11,950,344 12,191,138 698,499 694,778 11,251,845 11,496,360 4Q 37,260,277 971,028 1,844,177 485,563 1,282,883 342, 103 4,925,754 16,581,625 15,752,898 25,149,388 4,186,242 13,816,287 7,146,858 12,110,890 1,127,454 10,983,436 1Q 37,274,044 817,055 1,940,064 512,212 1,309,884 439,472 5,018,686 16,250,296 16,005,062 24,972,252 4,389,598 13,789,313 6,793,341 12,301,791 1,159,773 11,142,019 Year 2 20 3Q 36,583,446 36,974,388 746,281 895,371 2,178,453 2,177,678 492,416 548,096 1,250, 166 1,276,893 400,579 325,180 5,067,896 5,223,218 15,710,860 15,711,679 15,804,691 16,039,491 24,735,001 25,096,945 4,425,033 4,616,162 13,807,740 13,816,289 6,502,228 6,664,494 11,848,445 11,877,443 1,086,848 1,126,346 10,761,598 10,751,097 4Q 38,017,604 1,162,949 1,990, 129 537,155 1,301,565 299,264 5,291,062 15,763,752 16,962,789 26,652 253 4,564,156 14,331,077 7,757,020 11,365,351 1,144,742 10,220,609 1Q 37,846,044 844,464 2,141,181 506,442 1,340,436 371,579 5,204,102 15,586,579 17,055,363 26,402,819 5,309,781 14,003,437 7,089,600 11,443,225 1,162,183 10,281,043 Year 3 20 3Q 37,713,343 36,967,966 737,320 1,003,757 2,169,115 2,186,922 595,427 549,615 1,360,355 1,322,181 332,926 280.462 5,195, 142 5,342,937 15,576,321 14,859,755 16,941,880 16,765,274 26,044, 129 25,621,513 4,733,404 4,951,594 14,443,155 13,844,308 6,867,570 6,825,611 11,669,214 11,346,453 1,188,786 1,192,531 10,480,428 10,153,922 4Q 34.936,289 854,096 1,828,622 300.909 1,226, 187 604,136 4,813.950 13,767.183 16,355, 156 24,883,959 5,442,645 12,980, 122 6,461,191 10,052,330 1,157,936 8,894,394 1Q 34,424,512 938,840 1,917,426 389,430 1,226,236 422,456 4,894,386 13,371,249 16.158,876 24,860,270 5,892,038 13,402,452 5,565,780 9,564,242 1,138,395 8,425,846 20 33,998,601 491,656 2,017,652 378,663 1,192,132 379,941 4,460,044 13,339,772 16,198,785 24,060,390 4,433,533 13,868,432 5,758,424 9,938,211 1,172,404 8,765,807 Year Time 1 1 QTR 1 2 3 2 N 1 1 3 1 4 2 3 4 5 6 7 1 2 3 4 Total Total Total Assets Liabilities Stockholders' Equity 39612339 27387710 12224630 38397127 26446783 11950344 39043562.9 26852424.8 12191138 37260277.1 25149387.6 12110890 37274044 24972252 12301791 36583446.2 24735000.9 11848445 36974388.4 25096945.5 11877443 38017603.7 26652252.6 11365351 37846044.1 26402818.8 11443225 37713343.4 26044129.1 11669214 36967965.7 25621512.8 11346453 34936288.6 24883958.6 10052330 34424511.8 24860270.2 9564242 33998600.9 24060389.5 9938211 2 2 2 2 3 3 3 3 4 8 1 9 10 2 2 3 11 3 4 1 4 2 12 13 14 15 16 4 3 4 4 #2. Exponential Smoothing Models #2.1 Find the exponential smoothing forecasts for Total Liabilities for a = 0.4, a = 0.5, and a = 0.6 for the third period of the fourth year. a = 0.4 model: a = 0.5 model: a = 0.6 model: model #2.2 The MSE best of these three models is the a = because CEMEX S.A.B. de C.V. and subsidiaries Quarterly Balance Sheets under IFRS in thousands of U.S. dollars Year 4 3Q 4Q Total assets Cash and cash equivalents Trade receivables less allowance for doubtful accounts Other accounts receivable Inventories, net Other current assets Current assets Property, machinery and equipment, net Other assets Total liabilities Current liabilities Long-term liabilities Other liabilities Total stockholders' equity Non-controlling interest and perpetual instruments Total controlling interest 1Q 39,612,339 1,008,067 2,061,938 470,794 1,317,767 400,955 5,259,522 17,153,366 17,199,452 27,387,710 4,530,850 15,027,900 7,828,960 12,224,630 725,615 11,499,015 Year 1 20 3Q 38,397,127 39,043,563 625,081 785,237 2,169,761 2,182,687 466,507 499,675 1,304,872 1,288,113 364,590 316,330 4,930,810 5,072,043 16,586,924 16,563,208 16,879,393 17,408,311 26,446,783 26,852,425 4,015,209 4,250,027 14,850,640 14,807,684 7,580,934 7,794,713 11,950,344 12,191,138 698,499 694,778 11,251,845 11,496,360 4Q 37,260,277 971,028 1,844,177 485,563 1,282,883 342, 103 4,925,754 16,581,625 15,752,898 25,149,388 4,186,242 13,816,287 7,146,858 12,110,890 1,127,454 10,983,436 1Q 37,274,044 817,055 1,940,064 512,212 1,309,884 439,472 5,018,686 16,250,296 16,005,062 24,972,252 4,389,598 13,789,313 6,793,341 12,301,791 1,159,773 11,142,019 Year 2 20 3Q 36,583,446 36,974,388 746,281 895,371 2,178,453 2,177,678 492,416 548,096 1,250, 166 1,276,893 400,579 325,180 5,067,896 5,223,218 15,710,860 15,711,679 15,804,691 16,039,491 24,735,001 25,096,945 4,425,033 4,616,162 13,807,740 13,816,289 6,502,228 6,664,494 11,848,445 11,877,443 1,086,848 1,126,346 10,761,598 10,751,097 4Q 38,017,604 1,162,949 1,990, 129 537,155 1,301,565 299,264 5,291,062 15,763,752 16,962,789 26,652 253 4,564,156 14,331,077 7,757,020 11,365,351 1,144,742 10,220,609 1Q 37,846,044 844,464 2,141,181 506,442 1,340,436 371,579 5,204,102 15,586,579 17,055,363 26,402,819 5,309,781 14,003,437 7,089,600 11,443,225 1,162,183 10,281,043 Year 3 20 3Q 37,713,343 36,967,966 737,320 1,003,757 2,169,115 2,186,922 595,427 549,615 1,360,355 1,322,181 332,926 280.462 5,195, 142 5,342,937 15,576,321 14,859,755 16,941,880 16,765,274 26,044, 129 25,621,513 4,733,404 4,951,594 14,443,155 13,844,308 6,867,570 6,825,611 11,669,214 11,346,453 1,188,786 1,192,531 10,480,428 10,153,922 4Q 34.936,289 854,096 1,828,622 300.909 1,226, 187 604,136 4,813.950 13,767.183 16,355, 156 24,883,959 5,442,645 12,980, 122 6,461,191 10,052,330 1,157,936 8,894,394 1Q 34,424,512 938,840 1,917,426 389,430 1,226,236 422,456 4,894,386 13,371,249 16.158,876 24,860,270 5,892,038 13,402,452 5,565,780 9,564,242 1,138,395 8,425,846 20 33,998,601 491,656 2,017,652 378,663 1,192,132 379,941 4,460,044 13,339,772 16,198,785 24,060,390 4,433,533 13,868,432 5,758,424 9,938,211 1,172,404 8,765,807 Year Time 1 1 QTR 1 2 3 2 N 1 1 3 1 4 2 3 4 5 6 7 1 2 3 4 Total Total Total Assets Liabilities Stockholders' Equity 39612339 27387710 12224630 38397127 26446783 11950344 39043562.9 26852424.8 12191138 37260277.1 25149387.6 12110890 37274044 24972252 12301791 36583446.2 24735000.9 11848445 36974388.4 25096945.5 11877443 38017603.7 26652252.6 11365351 37846044.1 26402818.8 11443225 37713343.4 26044129.1 11669214 36967965.7 25621512.8 11346453 34936288.6 24883958.6 10052330 34424511.8 24860270.2 9564242 33998600.9 24060389.5 9938211 2 2 2 2 3 3 3 3 4 8 1 9 10 2 2 3 11 3 4 1 4 2 12 13 14 15 16 4 3 4 4


