Answered step by step
Verified Expert Solution
Link Copied!

Question

1 Approved Answer

2. Figure 1 plots changes in prices (in the vertical axis) in respond to changes in the yield to maturity (the horizontal axis) for four
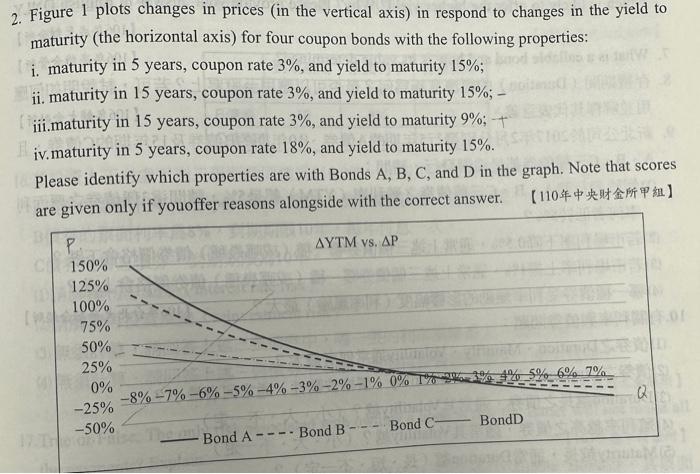
image text in transcribed
2. Figure 1 plots changes in prices (in the vertical axis) in respond to changes in the yield to maturity (the horizontal axis) for four coupon bonds with the following properties: i. maturity in 5 years, coupon rate 3%, and yield to maturity 15%; ii. maturity in 15 years, coupon rate 3%, and yield to maturity 15%; - iii.maturity in 15 years, coupon rate 3%, and yield to maturity 9%;+ iv. maturity in 5 years, coupon rate 18%, and yield to maturity 15%. Please identify which properties are with Bonds A,B,C, and D in the graph. Note that scores are given only if youoffer reasons alongside with the correct answer. 110

Step by Step Solution

There are 3 Steps involved in it

Step: 1

blur-text-image

Get Instant Access to Expert-Tailored Solutions

See step-by-step solutions with expert insights and AI powered tools for academic success

Step: 2

blur-text-image_2

Step: 3

blur-text-image_3

Ace Your Homework with AI

Get the answers you need in no time with our AI-driven, step-by-step assistance

Get Started

Recommended Textbook for

Crypto Technical Analysis It S More Than A Chart

Authors: Charles G. Koonitz

1st Edition

1989118690, 978-1989118696

More Books

Students also viewed these Finance questions