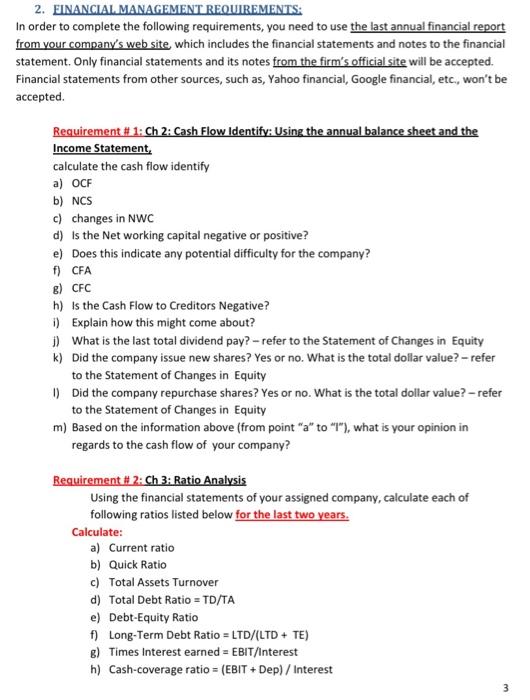
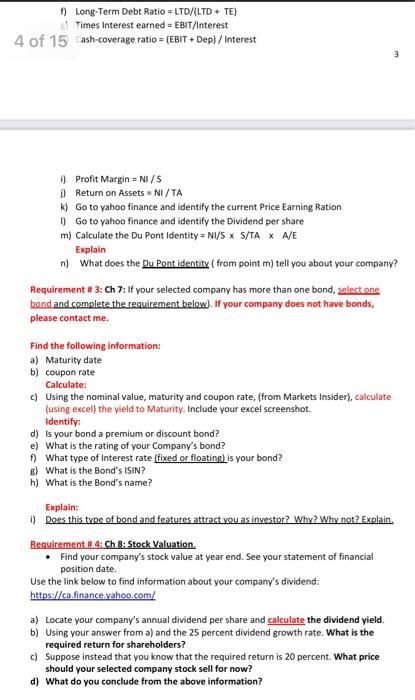
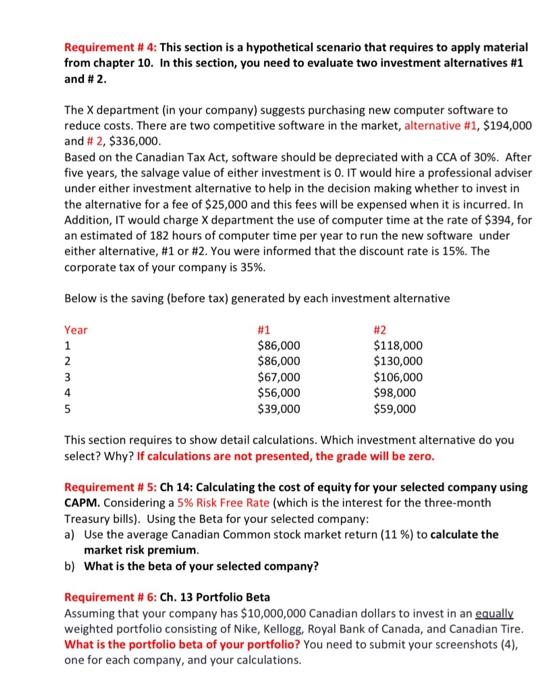
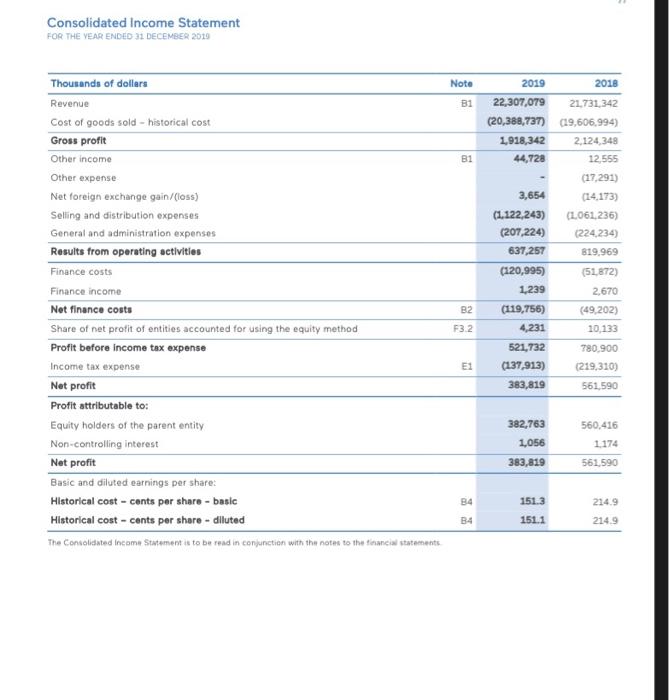
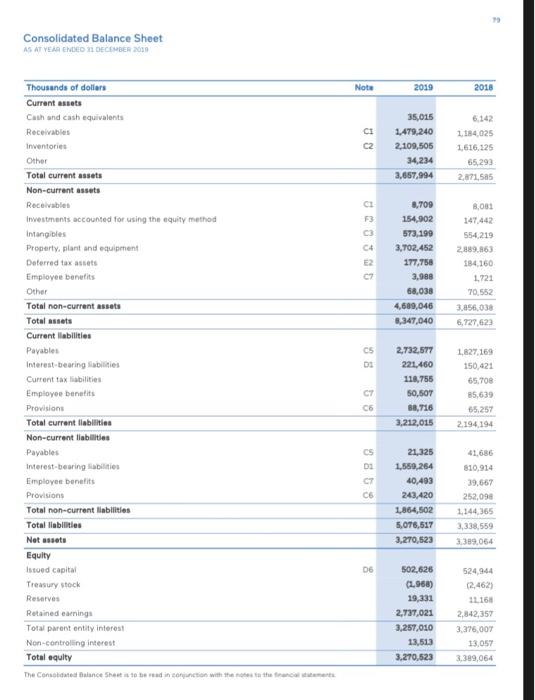
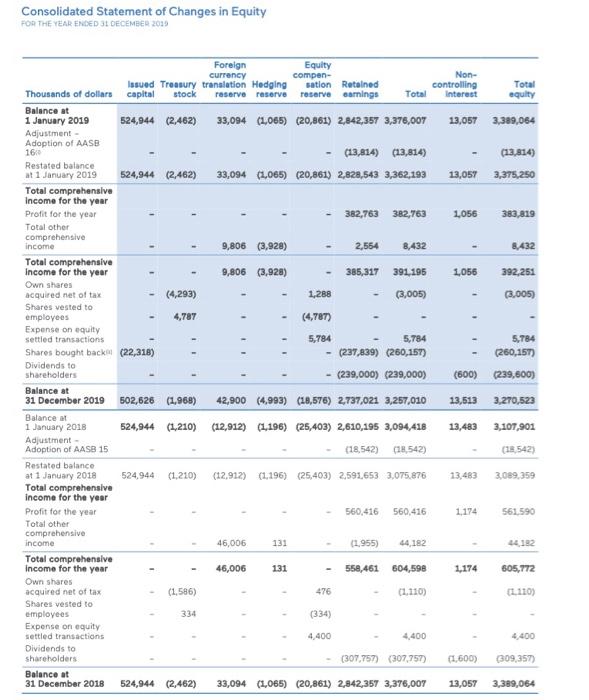
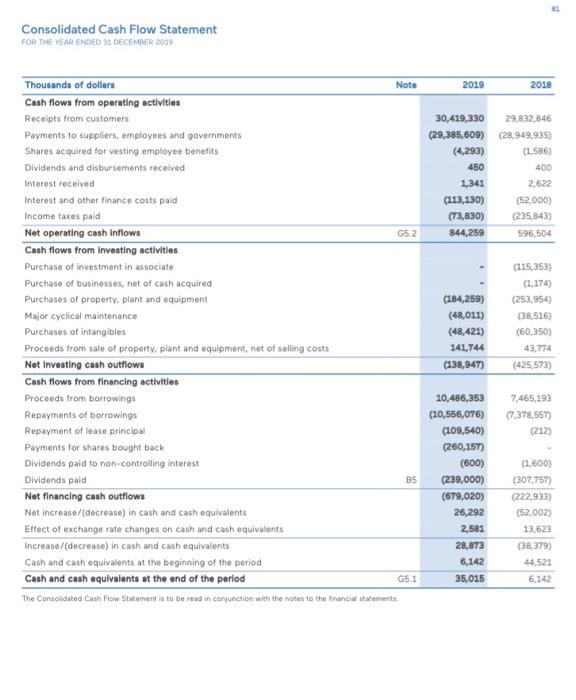
2. FINANCIAL MANAGEMENT REQUIREMENTS: In order to complete the following requirements, you need to use the last annual financial report from your company's web site which includes the financial statements and notes to the financial statement. Only financial statements and its notes from the firm's official site will be accepted. Financial statements from other sources, such as, Yahoo financial, Google financial, etc., won't be accepted. Requirement #1: Ch 2: Cash Flow Identify: Using the annual balance sheet and the Income Statement calculate the cash flow identify a) OCF b) NCS c) changes in NWC d) Is the Net working capital negative or positive? e) Does this indicate any potential difficulty for the company? ) CFA g) CFC h) Is the Cash Flow to Creditors Negative? i) Explain how this might come about? 1) What is the last total dividend pay? - refer to the Statement of Changes in Equity k) Did the company issue new shares? Yes or no. What is the total dollar value? - refer to the Statement of Changes in Equity O Did the company repurchase shares? Yes or no. What is the total dollar value? -refer to the Statement of Changes in Equity m) Based on the information above (from point "a" to "1"), what is your opinion in regards to the cash flow of your company? Requirement #2: Ch 3: Ratio Analysis Using the financial statements of your assigned company, calculate each of following ratios listed below for the last two years. Calculate: a) Current ratio b) Quick Ratio c) Total Assets Turnover d) Total Debt Ratio = TD/TA e) Debt-Equity Ratio f) Long-Term Debt Ratio - LTD/LTD + TE) 8) Times Interest earned = EBIT/Interest h) Cash-coverage ratio = (EBIT + Dep) / Interest 3 ) Long-Term Debt Ratio = LTD/LTD +TE) Times Interest earned = EBIT/Interest 4 of 15 ash-coverage ratio = (EBIT + Depl/Interest 3 D) Profit Margin = NI/S D Return on Assets=N/TA k) Go to yahoo finance and identify the current Price Earning Ration 1) Go to yahoo finance and identify the Dividend per share m) Calculate the Du Pont Identity=N/S X S/TAX A/E Explain n) What does the Du Pont identity (from point m) tell you about your company? Requirement #3: Ch 7: If your selected company has more than one bond select one band and complete the requirement below). If your company does not have bonds, please contact me Find the following information: a) Maturity date b) coupon rate Calculate: c) Using the nominal value, maturity and coupon rate, (from Markets Insider), calculate (using excel) the yield to Maturity. Include your excel screenshot. Identify: d) is your bond a premium or discount bond? e) What is the rating of your company's bond? f) What type of Interest rate (fixed or floating) is your bond? E) What is the Bond's ISIN? h) What is the Bond's name? Explain: i) Does this type of bond and features attract vou as investor? Why? Why not? Explain. Requirement 4 Ch 8: Stock Valuation Find your company's stock value at year end. See your statement of financial position date. Use the link below to find information about your company's dividend: https://ca.financo.yahoo.com/ a) Locate your company's annual dividend per share and calculate the dividend yield. b) Using your answer from a) and the 25 percent dividend growth rate. What is the required return for shareholders? c) Suppose instead that you know that the required return is 20 percent. What price should your selected company stock sell for now? d) What do you conclude from the above information? Requirement # 4: This section is a hypothetical scenario that requires to apply material from chapter 10. In this section, you need to evaluate two investment alternatives #1 and #2. The X department (in your company) suggests purchasing new computer software to reduce costs. There are two competitive software in the market, alternative #1, $194,000 and # 2, $336,000 Based on the Canadian Tax Act, software should be depreciated with a CCA of 30%. After five years, the salvage value of either investment is 0. It would hire a professional adviser under either investment alternative to help in the decision making whether to invest in the alternative for a fee of $25,000 and this fees will be expensed when it is incurred. In Addition, it would charge X department the use of computer time at the rate of $394, for an estimated of 182 hours of computer time per year to run the new software under either alternative, #1 or #2.You were informed that the discount rate is 15%. The corporate tax of your company is 35%. Below is the saving (before tax) generated by each investment alternative Year #1 #2 1 $86,000 $118,000 2 $86,000 $130,000 3 $67,000 $106,000 4 $56,000 $98,000 5 $39,000 $59,000 This section requires to show detail calculations. Which investment alternative do you select? Why? If calculations are not presented, the grade will be zero. Requirement #5: Ch 14: Calculating the cost of equity for your selected company using CAPM. Considering a 5% Risk Free Rate (which is the interest for the three-month Treasury bills). Using the Beta for your selected company: a) Use the average Canadian Common stock market return (11 %) to calculate the market risk premium. b) What is the beta of your selected company? Requirement #6: Ch. 13 Portfolio Beta Assuming that your company has $10,000,000 Canadian dollars to invest in an equally weighted portfolio consisting of Nike, Kellogg, Royal Bank of Canada, and Canadian Tire. What is the portfolio beta of your portfolio? You need to submit your screenshots (4), one for each company, and your calculations. Requirement #6: Ch. 13 Portfolio Beta Assuming that your company has $10,000,000 Canadian dollars to invest in an equally weighted portfolio consisting of Nike, Kellogg, Royal Bank of Canada, and Canadian Tire. What is the portfolio beta of your portfolio? You need to submit your screenshots (4), one for each company, and your calculations. 5 Requirement #7: Ch 14: Using the Risk Free rate 12 % Risk Free Rate) and assuming a 14 percent market risk premium, a) What is the cost of equity for your selected company using CAPM? b) You now need to calculate the cost of debt (after tax YTM) for your selected company, Use the info from Requirement 3c. c) What is the total market value if this bond (use markets insider to find other bond issues and the related price) Requirement #8 In addition to answer the Financial Management Question (above), this project will include: One page (double space, 12 font): Based on your calculations and relevant information, discuss the Financial Management Performance from your selected company from year-to-year (based on the annual financial report) from the point of view of the Shareholder One page (double space, 12 font): Based on your calculations and relevant information, discuss the Financial Management Performance from your selected company from year-to-year (based on the annual financial report) from the point of view of the Bondholders. One page (double space, 12 font): Based on your calculations and relevant information, discuss the Financial Management Performance from your selected company from year-to-year (based on the annual financial report) from the point of view of the Senior Management. One page (double space, 12 font): What are the Financial Management Strengths and Weaknesses of the firm? One page (double space, 12 font): clearly state your Financial Management Recommendations to improve your selected company's financial position. Reference (APA style) Consolidated Income Statement FOR THE VEAR ENDED 31 DECEMBER 2019 Note B1 B1 Thousands of dollars Revenue Cost of goods sold - historical cost Gross profit Other income Other expense Net foreign exchange gain/(loss) Seling and distribution expenses General and administration expenses Results from operating activities Finance costs Finance income Net finance costs Share of net profit of entities accounted for using the equity method Profit before income tax expense Income tax expense Net profit Profit attributable to: Equity holders of the parent entity Non-controlling interest Net profit Basic and diluted earnings per sbare: Historical cost - cents per share - basic Historical cost - cents per share - diluted The Consolidated Income Statement is to be read in conjunction with the notes to the financial statements 2019 2018 22,307,079 21731,342 (20,388,737) (19,606,994) 1,918,342 2,124,348 44,728 12.555 (17,291) 3,654 (14,173) (1.122,243) (1.061,236) (207,224) (224,234) 637,257 819,969 (120,995) (51.872) 1,239 2,670 (119,756) (49.202) 4,231 10,133 521,732 780.900 (137,913) (219,310) 383,819 561,590 B2 F3.2 E1 382,763 1,056 560,416 1.174 383,819 561,590 B4 151.3 151.1 214.9 214.9 B4 Consolidated Balance Sheet AS AT YEAR ENDED 1 DECEMBER 2010 Note 2019 2018 C2 35,015 1,479,240 2,109,505 34,234 3,657,994 6.142 1.184.025 1,616,125 65,293 2,871,585 C4 E2 07 8,709 154,902 573,199 3,702,452 177,758 3,988 68,038 4,689,046 8,347,040 8,081 147.442 554,219 2889,863 184 160 1.721 70,552 3.856.030 6.727,623 CS DI Thousands of dollars Current assets Cath and cash equivalents Receivables Inventories Other Total current assets Non-current assets Receivables Investments accounted for using the equity method Intangibles Property, plant and equipment Deferred tax assets Employee benefits Other Total non-current assets Total assets Current liabilities Payables Interest-bearing abilities Current tax liabilities Employee bentits Provisions Total current liabilities Non-current liabilities Payables Interest-bearing abilities Employee benefits Provisions Total non-current liabilities Total liabilities Net assets Equity Istoed capital Treasury stock Reserves Retained earnings Total parent entity interest Non-controlling interest Total aquity 2.732,577 221,460 118,755 50,507 88,716 3,212,015 1,827,169 150,421 65.708 85,639 65,257 2.194.194 C6 cs D1 C7 C6 21,325 1,559.264 40,493 243,420 1864,502 5,076,517 3,270,523 41.686 810,914 39,667 252,090 1.144.365 3,338,559 3.389,054 06 502,626 (1968) 19,331 2,737,021 3,257,010 13,513 3,270,523 524,944 (2,462) 11168 2.842,357 3,376,007 13,057 3.389,064 Consolidated Statement of Changes in Equity FOR THE YEAR ENDED SE DECEMBER 2013 Foreign Equity currency compen- Non- Issued Treasury translation Hedging sation Retained controlling Total Thousands of dollars capital stock reserve reserve reserve warnings Total Interest equilty Balance at 1 January 2019 524,944 (2,462) 33,094 (1,065) (20,961) 2,842,357 3,376,007 13,057 3,389,064 Adjustment Adoption of AASB 16 (13,814) (13,814) (13,814) Restated balance at 1 January 2019 524,944 (2,462) 33,094 (1,065) (20,861) 2,828,543 3,362,199 13,057 3,375,250 Total comprehensive Income for the year Profit for the year 382,763 382,763 1056 383,819 Total other comprehensive income 9,806 (3,928) 2,554 8,432 8.432 Total comprehensive Income for the year 9,806 (3,928) 385,317 391,195 1,056 392,251 Own shares acquired net of tax (4,293) 1,288 (3,005) 3,005) Shares vested to employees 4,787 (4,787) Expense on equity settled transactions 5,784 5,784 5,784 Shares bought back (22,318) - (237,839) (260,157) (260,157) Dividends to shareholders - (239,000) (229,000) (600) (239,600) Balance at 31 December 2019 502,626 (1,968) 42,900 (4,993) (28,576) 2,737,021 3,257,010 13,513 3,270,523 Balance at 1 January 2018 524,944 (1,210) (12,912) (1,196) (25,403) 2,610,195 3,094,418 13,483 3,107,901 Adjustment Adoption of AASB 15 (18,542) (18.542) (18.542) Restated balance at 1 January 2018 524,944 (1.210) (12,912) (1,196). (25,403) 2,593,653 3,075.876 13.483 3.089.359 Total comprehensive income for the year Profit for the year 560,416 560.416 1,174 561.590 Total other comprehensive income 46,006 131 (1955) 44182 Total comprehensive Income for the year 46,006 131 558,461 604,598 1,174 605,772 Own shares acquired net of tax (1,586) 476 (1.110) (110) Shares vested to employees 334 (334) Expense on equity settled transactions 4,400 4,400 4,400 Dividends to shareholders (307,757) (307,757 (1.600) (309,357) Balance at 31 December 2018 524,944 (2,462) 33,094 (1,065) (20,861) 2,842,357 3,376,007 13,057 3,389,064 2. FINANCIAL MANAGEMENT REQUIREMENTS: In order to complete the following requirements, you need to use the last annual financial report from your company's web site which includes the financial statements and notes to the financial statement. Only financial statements and its notes from the firm's official site will be accepted. Financial statements from other sources, such as, Yahoo financial, Google financial, etc., won't be accepted. Requirement #1: Ch 2: Cash Flow Identify: Using the annual balance sheet and the Income Statement calculate the cash flow identify a) OCF b) NCS c) changes in NWC d) Is the Net working capital negative or positive? e) Does this indicate any potential difficulty for the company? ) CFA g) CFC h) Is the Cash Flow to Creditors Negative? i) Explain how this might come about? 1) What is the last total dividend pay? - refer to the Statement of Changes in Equity k) Did the company issue new shares? Yes or no. What is the total dollar value? - refer to the Statement of Changes in Equity O Did the company repurchase shares? Yes or no. What is the total dollar value? -refer to the Statement of Changes in Equity m) Based on the information above (from point "a" to "1"), what is your opinion in regards to the cash flow of your company? Requirement #2: Ch 3: Ratio Analysis Using the financial statements of your assigned company, calculate each of following ratios listed below for the last two years. Calculate: a) Current ratio b) Quick Ratio c) Total Assets Turnover d) Total Debt Ratio = TD/TA e) Debt-Equity Ratio f) Long-Term Debt Ratio - LTD/LTD + TE) 8) Times Interest earned = EBIT/Interest h) Cash-coverage ratio = (EBIT + Dep) / Interest 3 ) Long-Term Debt Ratio = LTD/LTD +TE) Times Interest earned = EBIT/Interest 4 of 15 ash-coverage ratio = (EBIT + Depl/Interest 3 D) Profit Margin = NI/S D Return on Assets=N/TA k) Go to yahoo finance and identify the current Price Earning Ration 1) Go to yahoo finance and identify the Dividend per share m) Calculate the Du Pont Identity=N/S X S/TAX A/E Explain n) What does the Du Pont identity (from point m) tell you about your company? Requirement #3: Ch 7: If your selected company has more than one bond select one band and complete the requirement below). If your company does not have bonds, please contact me Find the following information: a) Maturity date b) coupon rate Calculate: c) Using the nominal value, maturity and coupon rate, (from Markets Insider), calculate (using excel) the yield to Maturity. Include your excel screenshot. Identify: d) is your bond a premium or discount bond? e) What is the rating of your company's bond? f) What type of Interest rate (fixed or floating) is your bond? E) What is the Bond's ISIN? h) What is the Bond's name? Explain: i) Does this type of bond and features attract vou as investor? Why? Why not? Explain. Requirement 4 Ch 8: Stock Valuation Find your company's stock value at year end. See your statement of financial position date. Use the link below to find information about your company's dividend: https://ca.financo.yahoo.com/ a) Locate your company's annual dividend per share and calculate the dividend yield. b) Using your answer from a) and the 25 percent dividend growth rate. What is the required return for shareholders? c) Suppose instead that you know that the required return is 20 percent. What price should your selected company stock sell for now? d) What do you conclude from the above information? Requirement # 4: This section is a hypothetical scenario that requires to apply material from chapter 10. In this section, you need to evaluate two investment alternatives #1 and #2. The X department (in your company) suggests purchasing new computer software to reduce costs. There are two competitive software in the market, alternative #1, $194,000 and # 2, $336,000 Based on the Canadian Tax Act, software should be depreciated with a CCA of 30%. After five years, the salvage value of either investment is 0. It would hire a professional adviser under either investment alternative to help in the decision making whether to invest in the alternative for a fee of $25,000 and this fees will be expensed when it is incurred. In Addition, it would charge X department the use of computer time at the rate of $394, for an estimated of 182 hours of computer time per year to run the new software under either alternative, #1 or #2.You were informed that the discount rate is 15%. The corporate tax of your company is 35%. Below is the saving (before tax) generated by each investment alternative Year #1 #2 1 $86,000 $118,000 2 $86,000 $130,000 3 $67,000 $106,000 4 $56,000 $98,000 5 $39,000 $59,000 This section requires to show detail calculations. Which investment alternative do you select? Why? If calculations are not presented, the grade will be zero. Requirement #5: Ch 14: Calculating the cost of equity for your selected company using CAPM. Considering a 5% Risk Free Rate (which is the interest for the three-month Treasury bills). Using the Beta for your selected company: a) Use the average Canadian Common stock market return (11 %) to calculate the market risk premium. b) What is the beta of your selected company? Requirement #6: Ch. 13 Portfolio Beta Assuming that your company has $10,000,000 Canadian dollars to invest in an equally weighted portfolio consisting of Nike, Kellogg, Royal Bank of Canada, and Canadian Tire. What is the portfolio beta of your portfolio? You need to submit your screenshots (4), one for each company, and your calculations. Requirement #6: Ch. 13 Portfolio Beta Assuming that your company has $10,000,000 Canadian dollars to invest in an equally weighted portfolio consisting of Nike, Kellogg, Royal Bank of Canada, and Canadian Tire. What is the portfolio beta of your portfolio? You need to submit your screenshots (4), one for each company, and your calculations. 5 Requirement #7: Ch 14: Using the Risk Free rate 12 % Risk Free Rate) and assuming a 14 percent market risk premium, a) What is the cost of equity for your selected company using CAPM? b) You now need to calculate the cost of debt (after tax YTM) for your selected company, Use the info from Requirement 3c. c) What is the total market value if this bond (use markets insider to find other bond issues and the related price) Requirement #8 In addition to answer the Financial Management Question (above), this project will include: One page (double space, 12 font): Based on your calculations and relevant information, discuss the Financial Management Performance from your selected company from year-to-year (based on the annual financial report) from the point of view of the Shareholder One page (double space, 12 font): Based on your calculations and relevant information, discuss the Financial Management Performance from your selected company from year-to-year (based on the annual financial report) from the point of view of the Bondholders. One page (double space, 12 font): Based on your calculations and relevant information, discuss the Financial Management Performance from your selected company from year-to-year (based on the annual financial report) from the point of view of the Senior Management. One page (double space, 12 font): What are the Financial Management Strengths and Weaknesses of the firm? One page (double space, 12 font): clearly state your Financial Management Recommendations to improve your selected company's financial position. Reference (APA style) Consolidated Income Statement FOR THE VEAR ENDED 31 DECEMBER 2019 Note B1 B1 Thousands of dollars Revenue Cost of goods sold - historical cost Gross profit Other income Other expense Net foreign exchange gain/(loss) Seling and distribution expenses General and administration expenses Results from operating activities Finance costs Finance income Net finance costs Share of net profit of entities accounted for using the equity method Profit before income tax expense Income tax expense Net profit Profit attributable to: Equity holders of the parent entity Non-controlling interest Net profit Basic and diluted earnings per sbare: Historical cost - cents per share - basic Historical cost - cents per share - diluted The Consolidated Income Statement is to be read in conjunction with the notes to the financial statements 2019 2018 22,307,079 21731,342 (20,388,737) (19,606,994) 1,918,342 2,124,348 44,728 12.555 (17,291) 3,654 (14,173) (1.122,243) (1.061,236) (207,224) (224,234) 637,257 819,969 (120,995) (51.872) 1,239 2,670 (119,756) (49.202) 4,231 10,133 521,732 780.900 (137,913) (219,310) 383,819 561,590 B2 F3.2 E1 382,763 1,056 560,416 1.174 383,819 561,590 B4 151.3 151.1 214.9 214.9 B4 Consolidated Balance Sheet AS AT YEAR ENDED 1 DECEMBER 2010 Note 2019 2018 C2 35,015 1,479,240 2,109,505 34,234 3,657,994 6.142 1.184.025 1,616,125 65,293 2,871,585 C4 E2 07 8,709 154,902 573,199 3,702,452 177,758 3,988 68,038 4,689,046 8,347,040 8,081 147.442 554,219 2889,863 184 160 1.721 70,552 3.856.030 6.727,623 CS DI Thousands of dollars Current assets Cath and cash equivalents Receivables Inventories Other Total current assets Non-current assets Receivables Investments accounted for using the equity method Intangibles Property, plant and equipment Deferred tax assets Employee benefits Other Total non-current assets Total assets Current liabilities Payables Interest-bearing abilities Current tax liabilities Employee bentits Provisions Total current liabilities Non-current liabilities Payables Interest-bearing abilities Employee benefits Provisions Total non-current liabilities Total liabilities Net assets Equity Istoed capital Treasury stock Reserves Retained earnings Total parent entity interest Non-controlling interest Total aquity 2.732,577 221,460 118,755 50,507 88,716 3,212,015 1,827,169 150,421 65.708 85,639 65,257 2.194.194 C6 cs D1 C7 C6 21,325 1,559.264 40,493 243,420 1864,502 5,076,517 3,270,523 41.686 810,914 39,667 252,090 1.144.365 3,338,559 3.389,054 06 502,626 (1968) 19,331 2,737,021 3,257,010 13,513 3,270,523 524,944 (2,462) 11168 2.842,357 3,376,007 13,057 3.389,064 Consolidated Statement of Changes in Equity FOR THE YEAR ENDED SE DECEMBER 2013 Foreign Equity currency compen- Non- Issued Treasury translation Hedging sation Retained controlling Total Thousands of dollars capital stock reserve reserve reserve warnings Total Interest equilty Balance at 1 January 2019 524,944 (2,462) 33,094 (1,065) (20,961) 2,842,357 3,376,007 13,057 3,389,064 Adjustment Adoption of AASB 16 (13,814) (13,814) (13,814) Restated balance at 1 January 2019 524,944 (2,462) 33,094 (1,065) (20,861) 2,828,543 3,362,199 13,057 3,375,250 Total comprehensive Income for the year Profit for the year 382,763 382,763 1056 383,819 Total other comprehensive income 9,806 (3,928) 2,554 8,432 8.432 Total comprehensive Income for the year 9,806 (3,928) 385,317 391,195 1,056 392,251 Own shares acquired net of tax (4,293) 1,288 (3,005) 3,005) Shares vested to employees 4,787 (4,787) Expense on equity settled transactions 5,784 5,784 5,784 Shares bought back (22,318) - (237,839) (260,157) (260,157) Dividends to shareholders - (239,000) (229,000) (600) (239,600) Balance at 31 December 2019 502,626 (1,968) 42,900 (4,993) (28,576) 2,737,021 3,257,010 13,513 3,270,523 Balance at 1 January 2018 524,944 (1,210) (12,912) (1,196) (25,403) 2,610,195 3,094,418 13,483 3,107,901 Adjustment Adoption of AASB 15 (18,542) (18.542) (18.542) Restated balance at 1 January 2018 524,944 (1.210) (12,912) (1,196). (25,403) 2,593,653 3,075.876 13.483 3.089.359 Total comprehensive income for the year Profit for the year 560,416 560.416 1,174 561.590 Total other comprehensive income 46,006 131 (1955) 44182 Total comprehensive Income for the year 46,006 131 558,461 604,598 1,174 605,772 Own shares acquired net of tax (1,586) 476 (1.110) (110) Shares vested to employees 334 (334) Expense on equity settled transactions 4,400 4,400 4,400 Dividends to shareholders (307,757) (307,757 (1.600) (309,357) Balance at 31 December 2018 524,944 (2,462) 33,094 (1,065) (20,861) 2,842,357 3,376,007 13,057 3,389,064