

Answered step by step
Verified Expert Solution
Question
1 Approved Answer
2 Finding Poles and Zeros from a Bode Plot Consider the magnitude portion of the Bode plot in Figure 3. Based on the linear
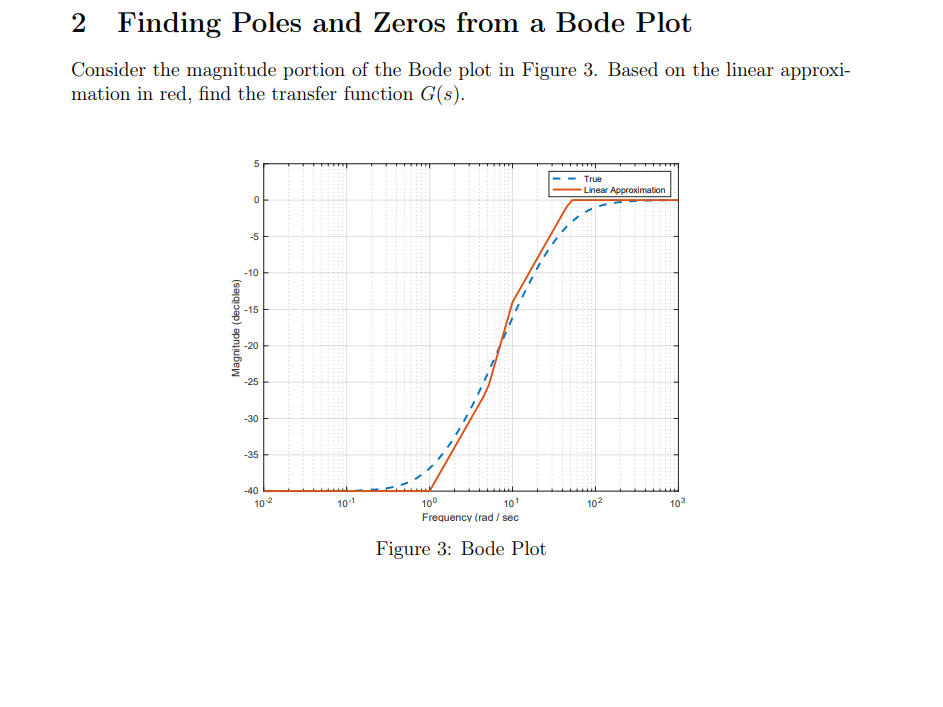
2 Finding Poles and Zeros from a Bode Plot Consider the magnitude portion of the Bode plot in Figure 3. Based on the linear approxi- mation in red, find the transfer function G(s). 5 0 -5 10 -10 -15 Magnitude (decibles) 20 -20 -25 30 -30 -35 -40 10-2 10-1 10 True Linear Approximation 101 102 00 Frequency (rad/sec Figure 3: Bode Plot 103
Step by Step Solution
There are 3 Steps involved in it
Step: 1
To find transfer function Gs from the bode plot given in the image we have to do the following steps ...
Get Instant Access to Expert-Tailored Solutions
See step-by-step solutions with expert insights and AI powered tools for academic success
Step: 2

Step: 3
Ace Your Homework with AI
Get the answers you need in no time with our AI-driven, step-by-step assistance
Get Started
Fundamentals of Ethics for Scientists and Engineers
Authors: Edmund G. Seebauer, Robert L. Barry
1st Edition
9780195698480, 195134885, 195698487, 978-0195134889