

Answered step by step
Verified Expert Solution
Question
1 Approved Answer
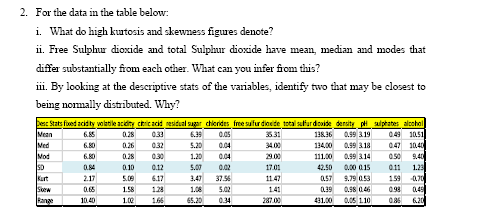
2. For the data in the table below: i. What do high kuntosis and skewness figures denote? ii. Free Sulphur dioxide and total Sulphur dioxide
Step by Step Solution
There are 3 Steps involved in it
Step: 1

Get Instant Access to Expert-Tailored Solutions
See step-by-step solutions with expert insights and AI powered tools for academic success
Step: 2

Step: 3
Ace Your Homework with AI
Get the answers you need in no time with our AI-driven, step-by-step assistance
Get Started
Applied Linear Algebra
Authors: Peter J. Olver, Cheri Shakiban
1st edition
131473824, 978-0131473829