Answered step by step
Verified Expert Solution
Link Copied!

Question

1 Approved Answer

2. Glass transition temperature in polymers For each of the following pairs of polymers, plot and label schematic specific volume vs T curves on the
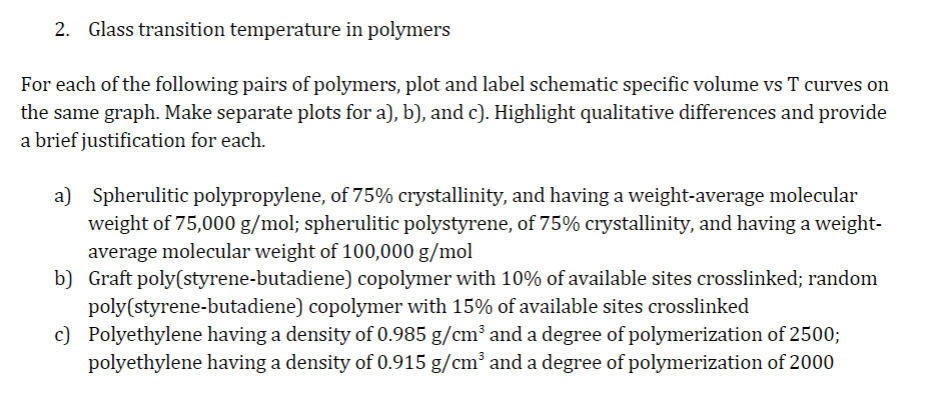
image text in transcribed

2. Glass transition temperature in polymers For each of the following pairs of polymers, plot and label schematic specific volume vs T curves on the same graph. Make separate plots for a), b), and c). Highlight qualitative differences and provide a brief justification for each. a) Spherulitic polypropylene, of 75% crystallinity, and having a weight-average molecular weight of 75,000 g/mol; spherulitic polystyrene, of 75% crystallinity, and having a weight- average molecular weight of 100,000 g/mol b) Graft poly(styrene-butadiene) copolymer with 10% of available sites crosslinked; random poly(styrene-butadiene) copolymer with 15% of available sites crosslinked c) Polyethylene having a density of 0.985 g/cm and a degree of polymerization of 2500; polyethylene having a density of 0.915 g/cm' and a degree of polymerization of 2000

Step by Step Solution

There are 3 Steps involved in it

Step: 1

blur-text-image

Get Instant Access to Expert-Tailored Solutions

See step-by-step solutions with expert insights and AI powered tools for academic success

Step: 2

blur-text-image

Step: 3

blur-text-image

Ace Your Homework with AI

Get the answers you need in no time with our AI-driven, step-by-step assistance

Get Started

Recommended Textbook for

Managerial Economics A Problem-Solving Approach

Authors: Luke M. Froeb, Brain T. Mccann

2nd Edition

B00BTM8FK0