Answered step by step
Verified Expert Solution
Link Copied!
Question
1 Approved Answer

2. Go to finance.yahoo.com, and search for General Motors (ticker symbol: GM). Go to the tab: Financials. Using the financial statements from 12/31/2020 (annual), calculate

image text in transcribed
2. Go to finance.yahoo.com, and search for General Motors (ticker symbol: GM). Go to the tab: Financials. Using the financial statements from 12/31/2020 (annual), calculate the following ratios: *You must write out the equation and the numbers used to get the final value for each ratio to receive credit for your answer. (9 points) a.Current Ratio b.Quick Ratio c. Times interest earned ratio d. Long-term debt ratio e. Receivables turnover f. Days' sales in receivables g. Total asset turnover h. Return on assets i.profit margin. Income Statement All numbers in thousands * Get access to 40+ years of historical data with Yahoo Finance Plus Essential. Leari Breakdown TTM 12/31/2020 > Total Revenue 139,639,000 122,485,000 118,603,000 108,813,000 Cost of Revenue Gross Profit 21,036,000 13,672,000 7,686,000 7,038,000 13,350,000 6,634,000 > Operating Expense Operating Income > Net Non Operating Interest Inc... > Other Income Expense 5,000 -857,000 2,930,000 2,318,000 Pretax Income 16,285,000 8,095,000 Tax Provision 3,677,000 1,774,000 > Net Income Common Stockhold... 12,573,000 6,247,000 Diluted NI Available to Com Stock... 12,573,000 6,247,000 Basic EPS 4.36 Diluted EPS 4.33 Basic Average Shares 1,433,000 Diluted Average Shares 1,442,000 yahoo! finance Search for news, symbols or companie 1,433,000 1,442,000 13,350,000 6,634,000 126,289,000 115,851.000 Basic Average Shares Diluted Average Shares Total Operating Income as Reported Total Expenses Net Income from Continuing & Dis... Normalized Income Interest Income Interest Expense Net Interest Income 12,749,000 6,427,000 12,543,835 6,220,035 1,100,000 241,000 1,095,000 1,098,000 5,000 -857.000 EBIT 17,380,000 9.193,000 EBITDA 29,655,000 Reconciled Cost of Revenue 118,603,000 108,813,000 12,275,000 12,815,000 6,427,000 12,749,000 265,000 265,000 Reconciled Depreciation Net Income from Continuing Oper... Total Unusual Items Excluding Goo... Total Unusual Items Normalized EBITDA Tax Rate for Calcs Tax Effect of Unusual Items 265,000 265,000 29,390,000 21,743,000 0 59,835 58,035

Step by Step Solution

There are 3 Steps involved in it

Step: 1

blur-text-image
Get Instant Access to Expert-Tailored Solutions

See step-by-step solutions with expert insights and AI powered tools for academic success

Step: 2

blur-text-image_2

Step: 3

blur-text-image_3

Ace Your Homework with AI

Get the answers you need in no time with our AI-driven, step-by-step assistance

Get Started

Recommended Textbook for

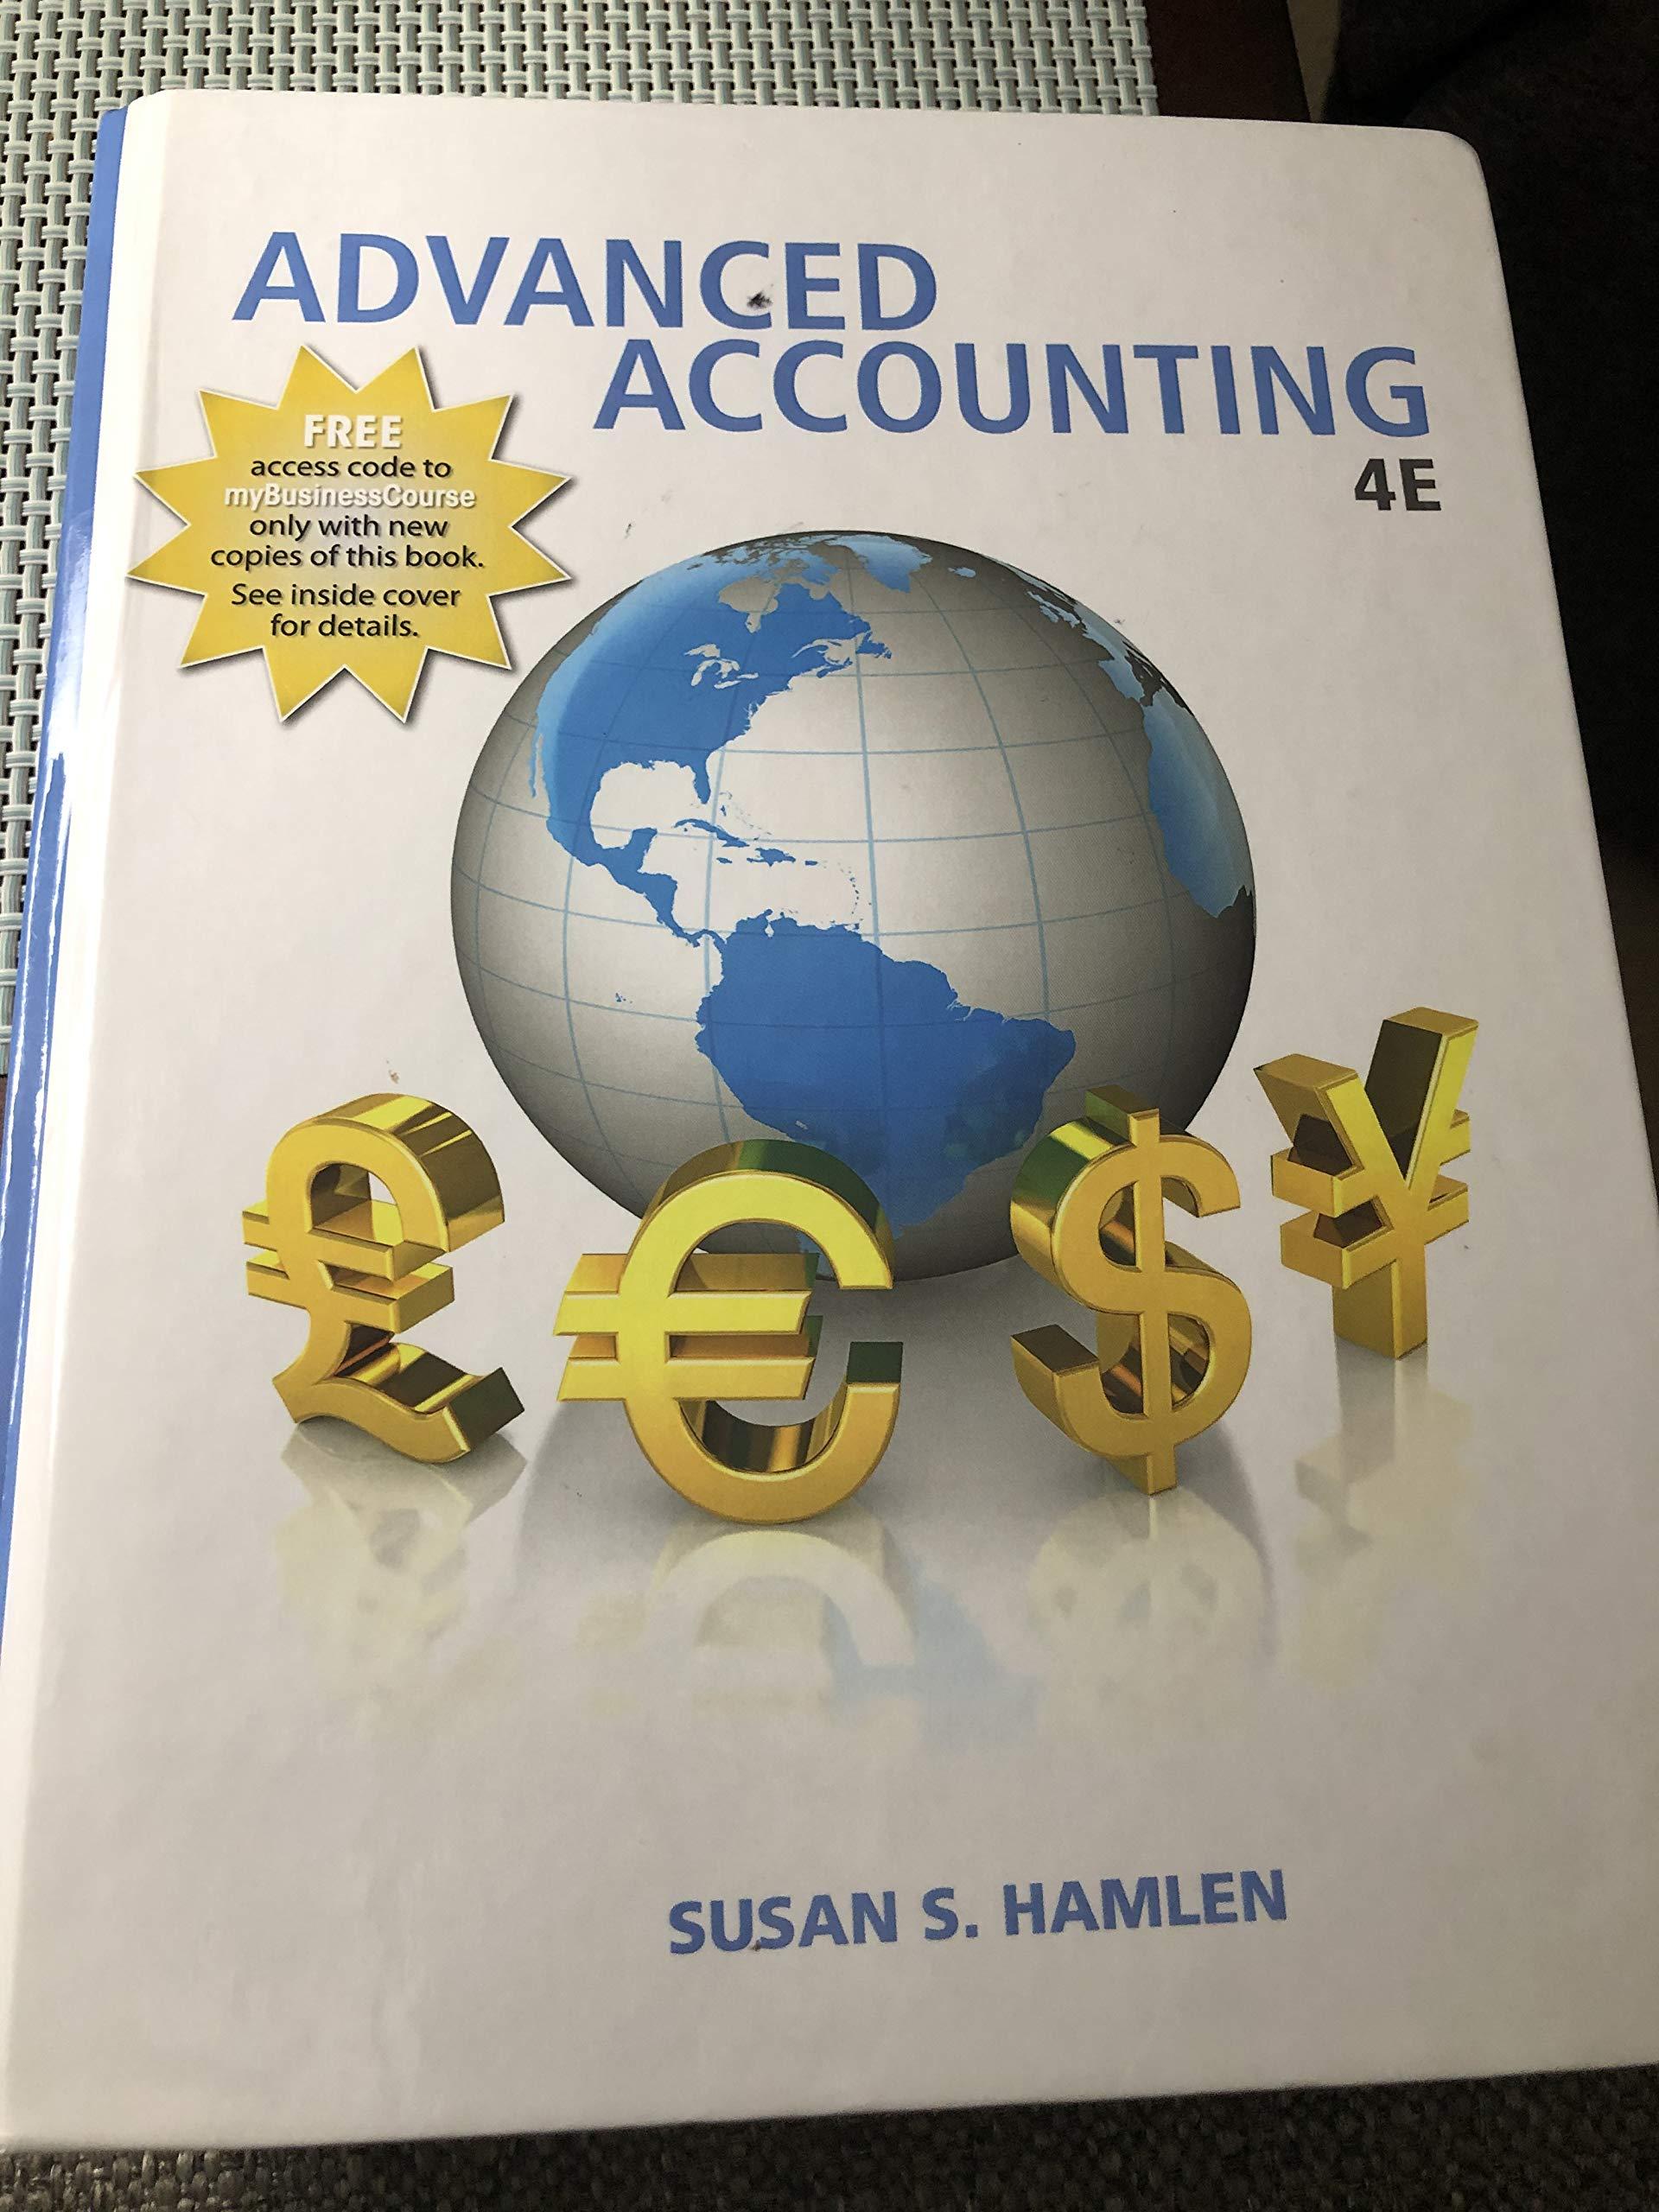
Advanced Accounting

Authors: Susan S. Hamlen

4th Edition

1618532618, 9781618532619

More Books

Students explore these related Accounting questions