

Answered step by step
Verified Expert Solution
Question
1 Approved Answer
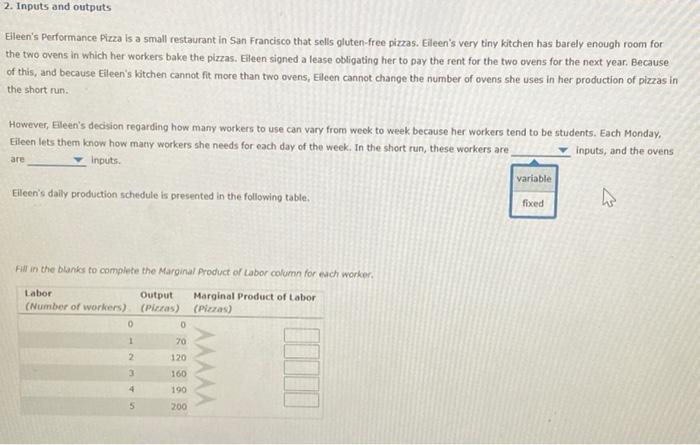
2. Inputs and outputs Elleen's Performance Pizza is a small restaurant in San Francisco that sells gluten-free pizzas. Eileen's very tiny kitchen has barely enough
Step by Step Solution
There are 3 Steps involved in it
Step: 1

Get Instant Access to Expert-Tailored Solutions
See step-by-step solutions with expert insights and AI powered tools for academic success
Step: 2

Step: 3
Ace Your Homework with AI
Get the answers you need in no time with our AI-driven, step-by-step assistance
Get Started
Essentials Of Cost Accounting For Health Care Organizations
Authors: Steven A. Finkler
1st Edition
0834205289, 978-0834205284