Answered step by step
Verified Expert Solution
Question
1 Approved Answer
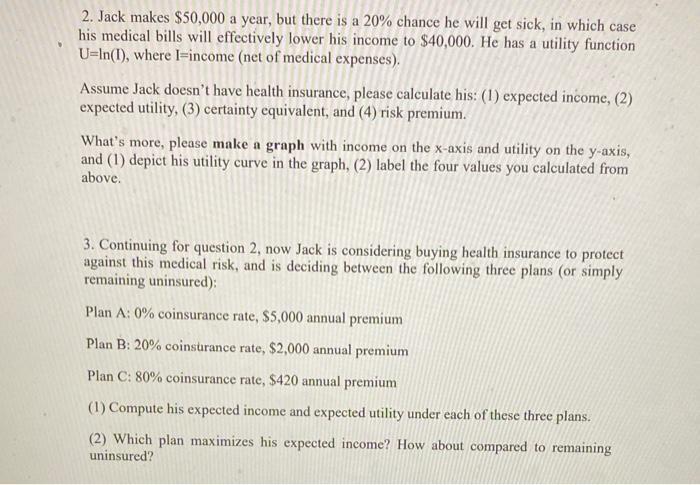
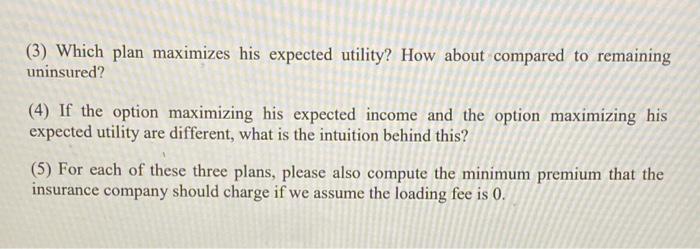
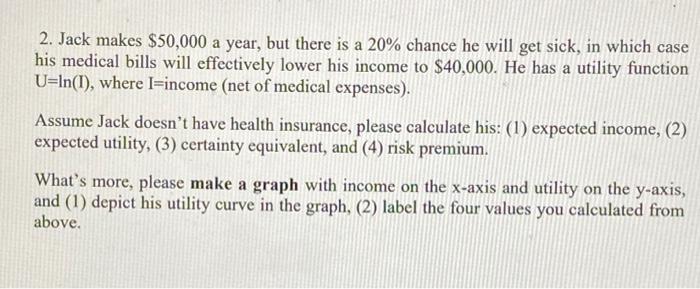
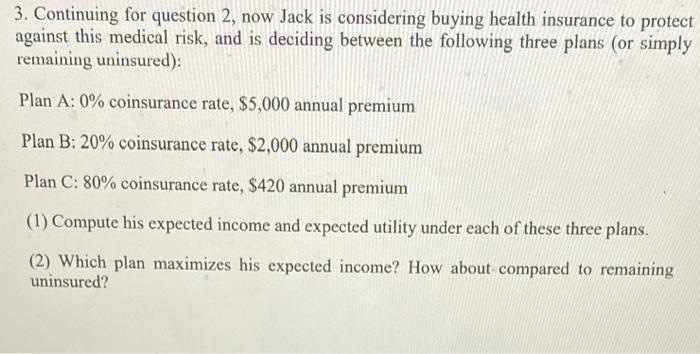
2. Jack makes $50,000 a year, but there is a 20% chance he will get sick, in which case his medical bills will effectively


2. Jack makes $50,000 a year, but there is a 20% chance he will get sick, in which case his medical bills will effectively lower his income to $40,000. He has a utility function U-In(I), where I-income (net of medical expenses). Assume Jack doesn't have health insurance, please calculate his: (1) expected income, (2) expected utility, (3) certainty equivalent, and (4) risk premium. What's more, please make a graph with income on the x-axis and utility on the y-axis, and (1) depict his utility curve in the graph, (2) label the four values you calculated from above. 3. Continuing for question 2, now Jack is considering buying health insurance to protect against this medical risk, and is deciding between the following three plans (or simply remaining uninsured): Plan A: 0% coinsurance rate, $5,000 annual premium Plan B: 20% coinsurance rate, $2,000 annual premium Plan C: 80% coinsurance rate, $420 annual premium (1) Compute his expected income and expected utility under each of these three plans. (2) Which plan maximizes his expected income? How about compared to remaining uninsured? (3) Which plan maximizes his expected utility? How about compared to remaining uninsured? (4) If the option maximizing his expected income and the option maximizing his expected utility are different, what is the intuition behind this? (5) For each of these three plans, please also compute the minimum premium that the insurance company should charge if we assume the loading fee is 0. 2. Jack makes $50,000 a year, but there is a 20% chance he will get sick, in which case his medical bills will effectively lower his income to $40,000. He has a utility function U=In(I), where I-income (net of medical expenses). Assume Jack doesn't have health insurance, please calculate his: (1) expected income, (2) expected utility, (3) certainty equivalent, and (4) risk premium. What's more, please make a graph with income on the x-axis and utility on the y-axis, and (1) depict his utility curve in the graph, (2) label the four values you calculated from above. 3. Continuing for question 2, now Jack is considering buying health insurance to protect against this medical risk, and is deciding between the following three plans (or simply remaining uninsured): Plan A: 0% coinsurance rate, $5,000 annual premium Plan B: 20% coinsurance rate, $2,000 annual premium Plan C: 80% coinsurance rate, $420 annual premium (1) Compute his expected income and expected utility under each of these three plans. (2) Which plan maximizes his expected income? How about compared to remaining uninsured? (3) Which plan maximizes his expected utility? How about compared to remaining uninsured? (4) If the option maximizing his expected income and the option maximizing his expected utility are different, what is the intuition behind this? (5) For each of these three plans, please also compute the minimum premium that the insurance company should charge if we assume the loading fee is 0.
Step by Step Solution
★★★★★
3.52 Rating (159 Votes )
There are 3 Steps involved in it
Step: 1
1 Expected income expected utility certainty equivalent and risk premium Expected income The expected income is the weighted average of the possible incomes where the weights are the probabilities of ...
Get Instant Access to Expert-Tailored Solutions
See step-by-step solutions with expert insights and AI powered tools for academic success
Step: 2

Step: 3

Ace Your Homework with AI
Get the answers you need in no time with our AI-driven, step-by-step assistance
Get Started


